Quantcast
Channel: HG2 – Undocumented Matlab
Viewing all 39 articles
Browse latest View live

Undocumented feature() function

$
0
0

Taking a short break from Java-related stuff in Matlab, I wanted to share and expand a reply I posted a short while ago on the StackOverflow forum, in response to a reader’s request to explain Matlab’s feature function. This article uses pure Matlab and is absolutely unrelated to Java, so those of you who are Java-phobic can be at ease trying this at home…

feature is an entirely undocumented and unsupported Matlab function, and unlike most other undocumented Matlab functions it actually does often change without prior notice between Matlab releases, so be very careful when using this function in your code.

feature accepts two arguments: the name of the feature and an optional new value. This is similar to get/set functions: When only one argument is supplied, Matlab returns the current feature value (like get), otherwise the value is modified (like set). In some rare cases (feature(‘timing’)), a third input argument is sometimes expected.

Feature names are case-insensitive. The built-in function system_dependent appears to be a synonym for feature (not exactly – some system_dependent features are unavailable in feature…). We can find several references to system_dependent online, mostly for old Matlab releases. There’s even an entry in the official Matlab FAQ (which has no usful info), and I’ve seen online references going all the way back to 1993…

One of the very rare official comments about this function says:

The system_dependent function is an unpublished function that we use for a variety of crufty things. It will most certainly change from time to time and possibly even go away completely. The system_dependent function performs different functionality on each of the platforms supported by MATLAB.

Several feature options have been reported over the years, mainly on the CSSM forum and also seen in the installed Matlab code base, as listed below (the code references are from the latest Matlab release – 7.10, aka R2010a). Note that many of these features may not work on your platform:

  • feature(‘usehg2′,flag) – this apparently relates to a new Handle-Graphics implementation that is under development for the past few years (I think I saw references to HG2 as far back as 2007, possibly earlier). HG2 is automatically active when Matlab is started with -hgVersion 2 option. It appears that the numeric HG handles have been replaced with their object-oriented (Matlab class system) handle counterparts in HG2 (today these class-system handles can be gotten using the handle function). Some handle properties are not implemented in HG2, and some GUI elements appear missing (figure menubar and toolbar, for example), but the basic plots look similar to our familiar HG. If anyone has any further information about HG2 I would love to hear it…
  • feature(‘useGBT2′) – “feature(‘useGBT2′) is only available when Matlab is started with -hgVersion 2 option.” – In /ja/xlate:15419; also see in: clf.m
  • feature(‘HGUsingMatlabClasses’) – see hgrc.m, subplot.m, title.m, xlabel.m, ylabel.m, zlabel.m, mesh.m, surf.m, colorbar.m etc. etc.
  • feature(‘JavaFigures’) – see propedit.m; disabled since R2007a when native (non-Java) Matlab figures were disabled.
  • feature(‘UseJava’) – see usejava.m
  • feature(‘ClearJava’,1) – see javaclasspath.m
  • feature(‘SetPrecision’) – accepts values 24, 53 or 64
  • feature(‘SetRound’) – accepts values 0, 0.5, Inf or -Inf
  • feature(‘IsDebug’) – see here; controls Matlab assertions.
  • feature(‘NewPrintAPI’) – see \toolbox\matlab\graphics\private\setup.m
  • feature(‘accel’,'on/off’) – see here and here. There is also a related feature(‘JIT’,'on/off’) which appears to control a subset of feature(‘accel’).
  • feature(‘GetOS’) – see ver.m
  • feature(‘GetWinSys’) – see ver.m
  • feature(‘GetPid’) – returns the Matlab process ID (well, actually the PID of its JVM but that’s the same PID as Matlab’s). Also see the similar java.lang.management.ManagementFactory.getRuntimeMXBean.getName.char. This latter function returns the PID mangled with the computer name (for example: ’1234@My-desktop’).
  • feature(‘GetCPU’) – see daqsupport.m (Data Acquisition Toolbox) and here
  • feature(‘NumCores’) – returns the number of CPU cores seen by Matlab
  • feature(‘NumThreads’) – see here
  • feature(‘MemStats’), feature(‘DumpMem’), feature(‘ProcessMem’) – these are memory reports that are even recommended by official MathWorks tech notes (1,2), newsletter and technical solutions (1,2). Numerous references to these features can be found online.
  • feature(‘CheckMallocMemoryUsage’) – see this official technical paper
  • feature(‘CheckMallocHeapWalk’) – see here
  • feature(‘ShowCommandWindow’) – see here = commandwindow
  • feature(‘LogDir’) – see here = tempdir
  • feature(‘HotLinks’) – used to disable hyperlinks in the Command Window. This is used by Word notebooks (see mwMatlabEval macro in the Microsoft Word template file %matlabroot%\notebook\pc\M-BOOK.DOT). Also see: info.m, mlint.m, doclink.m, guidefunc.m, displayEndOfDemoMessage.m
  • feature(‘UseOldFileDialogs’) – see toolbox\matlab\uitools\private\usejavadialog.m
  • feature(‘timing’) – For example: cpucount = feature(‘timing’,'cpucount’); There are several other 2nd arg options, as explained by the following informative error message:
    >> feature timing
    ??? Error using ==> feature
    Choose second argument from:
      'resolution_tictoc'  - Resolution of Tic/Toc clock in sec (double)
      'overhead_tictoc'    - Overhead of Tic/Toc command in sec (double)
      'cpucount'           - Current CPU cycles used (uint64) [Using utCPUcount]
      'getcpuspeed_tictoc' - Stored CPU cycles/sec (double) [Used by tic/toc]
      'cpuspeed'           - Current CPU cycles/sec (double) [Simple MathWorks]
      'winperfcount'       - Current CPU cycles used (uint64) [Windows call]
      'winperfspeed'       - Current CPU cycles/sec (double) [Windows call]
      'wintime'            - Current Windows time (uint32) [Windows call]
                             units: msec since startup [Wraps]
      'wintimeofday'       - Current time of day converted to file time (unit64)[Windows call]
                             units: 100 nsec since 01-Jan-1601 (UTC)
      'clocks_per_sec'     - clock() speed in cycles/sec [CLOCKS_PER_SEC]
     
    Choose second and third arguments from:
      'cpuspeed', double num             - Current CPU cycles/sec (double) [MathWorks - num iterations]
      'setcpuspeed_tictoc', double speed - Set the CPU cycles/sec [Used by tic/toc]
       uint64 arg2, uint64 arg3          - uint64 difference = arg2 - arg3 (uint64)
  • feature(‘memtic’), feature(‘memtoc’) – possibly related to feature(‘timing’); mentioned in /ja/xlate:5780-5781
  • feature(‘locale’) – see mlint.m, mtree.m, helpmenufcn.m
  • feature(‘DefaultCharacterSet’) – see here
  • feature(‘COM_SafeArraySingleDim’) – explained here and here.
  • feature(‘COM_ActxProgidCheck’,flag) – see /help/techdoc/helpsearch/_533.cfs
  • feature(‘FigureTools’) – see domymenu.m
  • feature(‘TimeSeriesTools’,1) – see /help/techdoc/helpsearch/_533.cfs
  • feature(‘launch_activation’, ‘forcecheck’) – see StudentActivationStatus.m
  • feature(‘EightyColumns’,flag) – see matlabrc.m
  • feature(‘GetSharedLibExt’) – see loadlibrary.m and /toolbox/matlab/audiovideo/private/privateMMReaderPluginSearch.m
  • feature(‘GetDefaultPrinter’) – see printdlg.m, printopt.m
  • feature(‘GetPrinterInfo’) – see pagesetupdlg.m
  • feature(‘GetPrinterColor’) – see /toolbox/matlab/graphics/private/defaultprtcolor.m
  • feature(‘GetSpecifiedPrinterPort’,printerName) – see /toolbox/matlab/graphics/private/send.m
  • feature(‘ShowFigureWindows’) – see printjob.m, printtables.m, /toolbox/matlab/graphics/private/warnfiguredialog.m
  • feature(‘SearchUDDClassesForHelp’) – see /toolbox/matlab/helptools/+helpUtils/@HelpProcess/getHelpText.m
  • feature(‘AutomationServer’) – see notebook.m, enableservice.m = enableservice(‘AutomationServer’, true)
  • feature(‘EnableDDE’,flag) – see enableservice.m = enableservice(‘DDEServer’, true)
  • feature(‘GetUserWorkFolder’) – see userpath.m, savepath.m
  • feature(‘DirsAddedFreeze’), feature(‘DirsAddedUnfreeze’) – see addpath.m
  • feature(‘ToolboxFreeze’), feature(‘ToolboxUnfreeze’) – explained here
  • feature(‘DirChangeHandleWarn’) – accepts ‘always’, ‘once’, ‘never’ or ‘status’. Mentioned in an official Matlab technical solution and also in changeNotificationAdvanced.m.
  • feature(‘DirReloadMsg’) – accepts ‘on’, ‘off’ or ‘status’. See changeNotificationAdvanced.m and here.
  • feature(‘RemoteCWDPolicy’) – accepts ‘Reload’, ‘TimecheckDir’, ‘TimecheckDirFile’, ‘TimecheckFile, ‘None’ or ‘status’. See changeNotification.m and here.
  • feature(‘RemotePathPolicy’) – accepts ‘Reload’, ‘TimecheckDir’, ‘TimecheckDirFile’, ‘TimecheckFile, ‘None’ or ‘status’. See changeNotification.m, here and this official technical solution.
  • feature(‘GetPref’,prefName) – returns the system preference value for the requested preference name in the global prefs file ([prefdir,'/matlab.prf']) that is explained here.
  • feature(‘IsDebugMode’) – mentioned here and several other online places
  • feature(‘ForceFramesOnBottom’) – mentioned here

Oddly, some features are only accessible via system_dependent, and not via feature:

  • system_dependent(‘builtinEditor’,flag) – see matlabrc.m
  • system_dependent(‘miedit’,filename) – referenced here, here and in edit.m. See matlabrc.m.
  • system_dependent(4,…) – See cedit.m, arrayviewfunc.m, dbmex.m, mexdebug.m. In addition to 4, I have seen references to features #2, 7-14, 44, 45, 1000-1003.
  • system_dependent(12,flag) – See %matlabroot%\notebook\pc\M-BOOK.DOT macro InitFromSavedSettings.

The following are OpenGL-related features that are used in the opengl.m function:

  • feature(‘OpenglMode’)
  • feature(‘OpenGLLoadStatus’)
  • feature(‘UseMesaSoftwareOpenGL’,1)- unix only
  • feature(‘UseGenericOpengl’,1)
  • feature(‘GetOpenglInfo’) = opengl(‘info’)
  • feature(‘GetOpenglData’) = opengl(‘data’)
  • feature(‘OpenGLVerbose’,1)

If you lasted this far you deserve a special treat: Last but not least we have feature(‘dwim’). Unfortunately, this feature sometimes fails on some systems…

Have you discovered or used any interesting feature? If so, please do share them in the comments section below

 
Related posts:
  1. Undocumented feature list A list of undocumented MATLAB features can be retrieved. Here's how... ...
  2. ismembc – undocumented helper function Matlab has several undocumented internal helper functions that can be useful on their own in some cases. This post presents the ismembc function....
  3. sprintfc – undocumented helper function The built-in sprintfc function can be used to quickly generate a cell-array of formatted strings. ...
  4. Legend ‘-DynamicLegend’ semi-documented feature The built-in Matlab legend function has a very useful semi-documented feature for automatic dynamic update, which is explained here....
 

Matlab’s HG2 mechanism

$
0
0

A few days ago I posted a lengthy article about Matlab’s undocumented feature function. In it, I mentioned a feature called HG2, that I believe merits a dedicated article, due to its potential high impact on future Matlab releases.

HG2, which presumably stands for “Handle Graphics 2nd generation”, was already reported in the past as an undocumented hidden figure property (UseHG2). In normal Matlab usage, this boolean property is ‘off’:

>> get(gcf,'usehg2')
ans =
off

HG2 is mentioned in quite a few Matlab files:

  • clf.m, hgload.m, ishg2figure.m, datetick.m, linkdata.m, linkplotfunc.m, cameratoolbar, /bin/registry/handle_graphics.xml, /ja/xlate and many more
  • uimodemanager.m (and others) temporarily disables a ‘MATLAB:handle:hg2′ warning
  • defaulterrorcallback.m mentions ‘MATLAB:HG2:SceneNode’ and ‘MATLAB:HG2:Property’
  • getplotbrowserproptable.m mentions several special HG2 types (hg2.Line, hg2.Lineseries, hg2.Patch etc.)
  • There’s even a dedicated /toolbox/matlab/graphics/private/ishg2figure.m function that determines whether a figure contains any HG2 graphics based on the existence of ‘hg2peer’ appdata (getappdata(fig,’hg2peer’)).
  • /toolbox/matlab/plottools/@objutil/@eventmanager/schema.m (and a few others) has the following comment:
     % may contain either UDD or MCOS listeners during the hg2 migration.

Obviously, much effort was invested in HG2 functionality. The fact that HG2 has been under development at least since 2007 (when I first discovered and reported it) seems to indicate a major upheaval in Matlab’s Handle Graphics mechanism. This hunch is reinforced by cryptic comments made by MathWorks personnel over the past few years that they are indeed looking at the HG system, which in their opinion is nearing its limitations. Perhaps I’m mixing unrelated stuff here, but it does make sense in light of Matlab’s push of its OOP class system over the past few releases.

To preview this HG2 system, we need to turn it on. Unfortunately, when we set the figure’s UseHG2 to ‘on’ there doesn’t seem to be any visible effect. However, this changes after we use the corresponding ‘UseHG2′ feature using the feature function (this caused lots of nasty-looking errors in past releases but works ok in R2010a):

>> feature('usehg2',1)

The /ja/xlate file (which is used in conjunction with the undocumented xlate function to translates Matlab messages from English to Japanese) has another key to unlocking HG2: This file contains the following message: “feature(‘useGBT2′) is only available when Matlab is started with -hgVersion 2 option.“. So let’s do as the xlate message advises and start a new Matlab session with the undocumented “-hgVersion 2″ command-line option. Now feature(‘usehg2′) is true by default and we can test the HG2 system.

Matlab looks basically the same in HG2 as in HG1. All the regular graphic functions behave just as we would expect from the existing (HG1) implementation. There are two major differences though:

  • the figure toolbars/menubars are missing and cannot be shown, even when the relevant figure properties are set. Without a menubar and toobar, Matlab figures are extremely less useful than their HG1 counterparts. This problem does not occur in HG2-enabled figures in the regular Matlab session (i.e., without using the “-hgVersion 2″ command-line option)
  • all the HG handles are now Matlab class handles rather than numeric values (These class handles are similar to those returned today (in HG1) using the undocumented handle function). There’s an exception to this rule: in regular Matlab sessions (i.e., without using the “-hgVersion 2″ command-line option), after setting the ‘UseHG2′ feature on, the returned figure handle is numeric rather than a class handle (but if you now plot within this figure you get the class object handles). Here’s the output from the “-hgVersion 2″ Matlab session:
    >> hFig = figure
    hFig = 
    	ui.Figure
     
    >> hLine = plot(1:5)
    hLine = 
    	hg2.Lineseries
     
    >> get(hLine,'Parent')
    ans = 
    	hg2.Axes
     
    >> findprop(gcf,'Tag')
    ans = 
      meta.property handle
      Package: meta
     
      Properties:
                       Name: 'Tag'
                Description: 'Tag PropInfo'
        DetailedDescription: ''
                  GetAccess: 'public'
                  SetAccess: 'public'
                  Dependent: 1
                   Constant: 0
                   Abstract: 0
                  Transient: 0
                     Hidden: 0
              GetObservable: 1
              SetObservable: 1
                   AbortSet: 0
                  GetMethod: []
                  SetMethod: []
                 HasDefault: 0
              DefiningClass: [1x1 meta.class]
      Methods, Events, Superclasses
     
    >> methods(gcf)
     
    Methods for class ui.Figure:
     
    Figure                  disp                    get                     horzcat                 lt                      subsasgn                
    addlistener             double                  getParentImpl           ishghandlewithargs      ne                      vertcat                 
    addprop                 eq                      getSceneViewer          ishghandlewoargs        notify                  
    applydefaultproperties  findobj                 getdisp                 isvalid                 reset                   
    cat                     findprop                gt                      java                    set                     
    delete                  ge                      hgclose                 le                      setdisp                 
     
    Static methods:
     
    getDefaultObject        
     
    >> methods(gcf,'-full')
     
    Methods for class ui.Figure:
     
    ui.Figure lhs1 Figure(rhs0)
    event.listener L addlistener(handle sources, char vector eventname, function_handle scalar callback)  % Inherited from hg2utils.HGHandle
    event.proplistener L addlistener(handle sources, meta.property propertyname, char vector eventname, function_handle scalar callback)  % Inherited from hg2utils.HGHandle
    event.proplistener L addlistener(handle sources, string propertyname, char vector eventname, function_handle scalar callback)  % Inherited from hg2utils.HGHandle
    event.proplistener L addlistener(handle sources, cell propertyname, char vector eventname, function_handle scalar callback)  % Inherited from hg2utils.HGHandle
    meta.property prop addprop(handle scalar object, string propname)  % Inherited from dynamicprops
    applydefaultproperties(HGHandle object, rhs1)  % Inherited from hg2utils.HGHandle
    HeterogeneousHandle lhs3 cat(double rhs0, rhs1, rhs2)  % Inherited from HeterogeneousHandle
    delete(handle obj)  % Inherited from handle
    disp(object)  % Inherited from hg2utils.HGHandle
    lhs1 double(handle object)  % Inherited from hg2utils.HGHandle
    logical TF eq(A, B)  % Inherited from hg2utils.HGHandle
    handle output findobj(handle object, varargin)  % Inherited from hg2utils.HGHandle
    meta.property prop findprop(handle scalar object, string propname)  % Inherited from handle
    logical TF ge(A, B)  % Inherited from handle
    varargout get(hgsetget object, rhs1)  % Inherited from hg2utils.HGHandle
    Static HeterogeneousHandle lhs0 getDefaultObject  % Inherited from hg2utils.HGHandle
    lhs2 getParentImpl(handle scalar object, rhs1)  % Inherited from hg2utils.HGObject
    lhs2 getSceneViewer(handle scalar object, rhs1)  % Inherited from ui.UISceneViewerParent
    getdisp(hgsetget rhs0)  % Inherited from hgsetget
    logical TF gt(A, B)  % Inherited from handle
    hgclose(handle scalar object)
    HeterogeneousHandle lhs2 horzcat(rhs0, rhs1)  % Inherited from HeterogeneousHandle
    lhs2 ishghandlewithargs(handle scalar object, rhs1)  % Inherited from hg2utils.HGObject
    lhs1 ishghandlewoargs(handle scalar object)  % Inherited from hg2utils.HGObject
    logical validity isvalid(handle obj)  % Inherited from handle
    j java(JavaVisible scalar h)  % Inherited from JavaVisible
    logical TF le(A, B)  % Inherited from handle
    logical TF lt(A, B)  % Inherited from handle
    logical TF ne(A, B)  % Inherited from hg2utils.HGHandle
    notify(handle sources, string eventname, event.EventData scalar eventdata)  % Inherited from handle
    notify(handle sources, string eventname)  % Inherited from handle
    reset(handle scalar object)  % Inherited from hg2utils.HGHandle
    varargout set(hgsetget object, rhs1)  % Inherited from hg2utils.HGHandle
    setdisp(hgsetget rhs0)  % Inherited from hgsetget
    varargout subsasgn(rhs0, rhs1, rhs2, rhs3)  % Inherited from HeterogeneousHandle
    HeterogeneousHandle lhs2 vertcat(rhs0, rhs1)  % Inherited from HeterogeneousHandle

The latest Matlab releases have shown how the Matlab handle class can be extended using user-created derived classes. It stands to reason that so do all the new HG2 objects. This would theoretically enable Matlab programmers to customize graphic objects appearance to suit their needs in a more intuitive manner than possible using HG1.

Many mysteries remain:

  • is it possible to mix HG1 and HG2 objects in the same figure?
  • can we switch between HG1 and HG2 in the same Matlab session (I got some crashes…)?
  • why is there a need for the separate feature options ‘UseHG2′, ‘UseGBT2′ and ‘HGUsingMatlabClasses’?
  • why is there a need for “-hgVersion 2″ Matlab sessions if we can simply use feature(‘UseHG2′)?
  • is it possible to restore the figure menubar and toolbar in “-hgVersion 2″ Matlab sessions?
  • is it indeed possible to extend HG2 objects using user-defined classes? and if so, can we modify the appearance/behavior beyond what is available in the existing list of HG2 properties?
  • beyond changing numeric handles into class handles, are there any actual benefits to the HG2 system over HG1?
  • what is the difference between HG2, GBT2 and GBT1.5 (which are mentioned together as separate entities in cameratoolbar.m)?

HG2 is still buggy, which explains why it is still not officially released. For example, the inspect(gca) function crashes Matlab, figure toolbars/menubars are missing, and some properties that are available in HG1 are missing in HG2. Also, we can add Java components to a Matlab figure using javacomponent as in HG1 (the returned container handles is a ui.HGJavaComponent class handle), but we get an error when we close the figure…

Still, with all this effort invested into HG2 I believe that it is only a matter of time before HG2 becomes officially released. This could happen perhaps even as soon as the upcoming R2010b release, but with the current state as seen above I suspect it will not happen before 2011. Also, my gut feeling is that Matlab will define any release that includes HG2 as a major release and we will finally have Matlab 8.0.

I would dearly love to hear any further information anyone discovers about HG2 and related issues. Please share your findings by email or in the comments section below.

 
Related posts:
  1. New information on HG2 More information on Matlab's new HG2 object-oriented handle-graphics system...
  2. Controlling plot data-tips Data-tips are an extremely useful plotting tool that can easily be controlled programmatically....
  3. Handle Graphics Behavior HG behaviors are an important aspect of Matlab graphics that enable custom control of handle functionality. ...
  4. Customizing uiundo This article describes how Matlab's undocumented uiundo undo/redo manager can be customized...
 

New information on HG2

$
0
0

Last week I posted a couple of articles on the undocumented feature function and Matlab’s apparent move towards a class-based Handle-Graphics system called HG2.

Apparently I caused a bit of a stir…

This is normally a weekly blog. But I wanted to share some additional relevant information as well as some interesting tips I received in private communications. Please note that much of the following is speculation or guesswork and may be incorrect or even entirely wacky. Please read the following with more than the usual grain of skepticism…

UDD

A bit of historical background: Matlab’s existing Handle Graphics system is based on UDD (Universal Data Dictionary) objects. Prior to Matlab Release 12 (a.k.a. 6.0) back in 2000, Matlab was written exclusively in C and HG and Simulink used differing approaches to objects in the MathWorks codebase. UDD was then added for R12 using C++ code with C wrappers for internal use by the MathWorks developers. UDD enabled a new unified approach for HG and Simulink (recall the major overhaul to the Matlab interface in that release, which also modified the GUI to be Java-based). While the HG handles remained numeric, behind the scenes they relied on the new UDD system, which remained undocumented.

Matlab users who wished to leverage UDD classes could (and still can) access it via some undocumented interface functions: handle, handle.listener, handle.event, classhandle, schema.prop, schema.class, schema.event (and other schema.* functions), findprop, findclass, findevent and several others. Some of these functions were mentioned in past articles on this blog, and others will perhaps be explained in future articles. You can find numerous mentions and usage examples of UDD in the Matlab codebase that is part of each Matlab installation.

In /toolbox/matlab/helptools/+helpUtils/@HelpProcess/getHelpText.m we can see a related feature (feature(‘SearchUUDClassesForHelp’, flag)) which can apparently be used to allow access to the h1 line and help text for UDD methods. Unfortunately, I have not found any relevant UDD candidates for this. I would be very happy to hear if you know of any objects/methods which have a UDD help section.

MCOS

Perhaps Matlab’s Class Object System (MCOS), first introduced in R14 (a.k.a. 7.0, released in 2004) grew out of the UDD beginnings, and perhaps it was developed separately. The fact is that it shared several terms and concepts (“schema”, properties meta-data, events) with UDD, although no direct interaction between UDD and MCOS exists, AFAIK.

As an interesting side-note, MCOS was introduced as an opt-in beta-testing feature in R14SP2 (7.0.4, released in 2005). This beta feature cannot be found in the official online version of the R14SP2 release notes, but can be found in the hardcover version pages 10-11:

New syntax and features for creating and working with classes in MATLAB. For R14SP2, these features are at a Beta level. If you are interested in being a Beta tester for these features, see “Beta Test the MATLAB Class System” on page 11.

Beta Test the MATLAB Class System. MATLAB 7.0.4 includes a Beta version of new syntax and features for working with classes in MATLAB, which simplify and expand object-oriented programming capabilities in MATLAB. Participation in this Beta program is open only to customers who are current
on their maintenance for MATLAB. Trial passcodes will not be made available for this Beta test. If you are interested in being a Beta tester for these features, register on the MathWorks Web site, at http://www.mathworks.com/products/beta/r14sp2/signup_newfeatures.html.

(needless to say, this webpage was since removed…)

The MCOS syntax has changed between releases and was not very stable, until it was formally introduced in R2008a (a.k.a. 7.6, released in 2008). You can look at /toolbox/matlab/iofun/@memmapfile/memmapfile.m to see the MCOS evolution from R14 onward.

HG2

The new HG2 appears to be a merger of MCOS and UDD, using MCOS infrastructure for UDD classes and properties, finally throwing away the old numeric handles and C wrappers for the more powerful object-oriented approach.

For the transition period between HG and HG2, there seems to be a dedicated feature: feature(‘HGtoCOS’, handle) apparently converts a UDD (“HG”) handle into an HG2 (“COS”) handle. You can also use feature(‘HGtoCOS’, 0) to obtain an MCOS object of the desktop (=handle 0). Here is a sample result on a Matlab 2009 release:

>> hFig = figure
hFig =
     1
 
>> fmcos = feature('HGtoCOS', hFig)
fmcos =
 
  gbtmcos.figure handle
 
  Package: gbtmcos
 
  Properties:
                 Alphamap: [1x64 double]
             BeingDeleted: 'off'
               BusyAction: 'queue'
            ButtonDownFcn: []
                 Children: [0x1 double]
                 Clipping: 'on'
          CloseRequestFcn: 'closereq'
                    Color: [0.8000 0.8000 0.8000]
                 Colormap: [64x3 double]
                      ...  (all the regular figure properties)

Note that in that here, the new object package was called GBTMCOS – perhaps meaning a GBT version of the MCOS system. This corresponds to the feature(‘useGBT2′) that I reported in the features article. I have absolutely no idea what GBT stands for, whether it is a synonym for HG2 or not exactly, and what the differences are between GBT1.5 and GBT2. In any case, in R2010a, the same feature(‘HGtoCOS’, handle) code returns a ui.figure object: “GBTMCOS” was simply renamed “UI”.

I do not know how to convert an HG2 back to a UDD/HG handle. None of the following appears to work:

>> fmcos.getdoubleimpl
ans =
    -1
 
>> fmcos.double
ans =
on
 
>> double(fmcos)
ans =
    -1
 
>> handle(fmcos)
??? Error using ==> handle
Cannot convert to handle.

I would love to hear any additional information on these subjects, either anonymously or on record. You can use either a direct mail (see link at the top-right of this page) or the comments section.

 
Related posts:
  1. Introduction to UDD UDD classes underlie many of Matlab's handle-graphics objects and functionality. This article introduces these classes....
  2. Matlab’s HG2 mechanism HG2 is presumably the next generation of Matlab graphics. This article tries to explore its features....
  3. uiundo – Matlab’s undocumented undo/redo manager The built-in uiundo function provides easy yet undocumented access to Matlab's powerful undo/redo functionality. This article explains its usage....
  4. Creating a simple UDD class This article explains how to create and test custom UDD packages, classes and objects...
 

handle2struct, struct2handle & Matlab 8.0

$
0
0

Last week I explained that FIG files are simply MAT files in disguise. Today, we look under the hood of Matlab’s hgsave function, which is used to save FIG files. We shall see that this is both useful and illuminating vis-a-vis Matlab’s future.

handle2struct

Under the hood, hgsave uses the semi-documented built-in handle2struct function to convert the figure handle into a Matlab struct that is then stored with a simple save (the same function that saves MAT files) function call.

The fact that handle2struct is semi-documented means that the function is explained in a help comment (which can be seen via the help command), that is nonetheless not part of the official doc sections. It is an unsupported feature originally intended only for internal Matlab use (which of course doesn’t mean we can’t use it).

handle2struct merits a dedicated mention, since I can envision several use-cases for storing only a specific GUI handle (for example, a uipanel, a specific graph, or a set of GUI controls’ state). In this case, all we need to do is to call handle2struct with the requested parent handle, then save the returned structure. So simple, so powerful. handle2struct automatically returns all the non-default property information, recursively in all the handle’s children.

Note that features that are not properties of displayed handles (camera position, 3D rotation/pan/zoom states, annotations, axes-linking etc.) are not processed by handle2struct. For storing the states of these features, you need to use some specific handling – see the code within %matlabroot%\toolbox\matlab\graphics\private\hgsaveStructDbl.m for details. Basically, hgsaveStructDbl.m reads the state of all these features and temporarily stores them in the base handle’s ApplicationData property; handle2struct then reads them as any other regular handle property data, and then hgsaveStructDbl.m clears the temporary data from the handle’s ApplicationData. We can use the same trick for any other application state, of course.

struct2handle

handle2struct has a reverse function – the semi-documented struct2handle. I use it for creating dynamic preference panels: As in Matlab’s Preferences window, I have a list of preference topics and a set of corresponding options panels. In my case, it was easy to design each panel as a separate FIG file using GUIDE. In run-time, I simply load the relevant panel from its FIG file as described above, and place it onscreen in a dedicated uipanel using struct2handle. This enables very easy maintenance of preference panels, without sacrificing any functionality.

Matlab's preferences panels

Matlab's preferences panels

Figure menus and toolbars are not normally stored by hgsave, unless you use the optional ‘all’ parameter (and correspondingly in hgload, if you choose to use it). handle2struct and handle2struct accept the same optional ‘all’ parameter as hgsave and hgload. Unfortunately, a warning message indicates that this option will be discontinued in some future Matlab version.

Which brings us to our final topic for today:

Matlab 8: Boldly going where no FIG has gone before…

Remember my post earlier this year about the new HG2 mechanism? I speculated that when MathWorks decides to release HG2, it will define this as a major Matlab release and label it Matlab 8.0.

The source code in hgsave.m appears to confirm my speculation. Here is the relevant code section (slightly edited for clarity), which speaks for itself:

% Decide which save code path to use
if ~feature('HGUsingMatlabClasses')   % <== existing HG
    % Warn if user passed in 'all' flag
    if SaveAll
        warning( 'MATLAB:hgsave:DeprecatedOption', ...
            'The ''all'' option to hgsave will be removed in a future release.');
    end
    hgS = hgsaveStructDbl(h, SaveAll);
    SaveVer = '070000';
    SaveOldFig = true;
 
else   % <== HG2
 
    % Warn if user passed in 'all' flag
    if SaveAll
        warning( 'MATLAB:hgsave:DeprecatedOption', ...
            'The ''all'' option to hgsave has been removed.');
    end
    if SaveOldFig
        hgS = hgsaveStructClass(h);
        SaveVer = '080000';
    else
        hgO = hgsaveObject(h);
        SaveVer = '080000';
    end
end
 
% Revision encoded as 2 digits for major revision,
% 2 digits for minor revision, and 2 digits for
% patch revision.  This is the minimum revision
% required to fully support the file format.
% e.g. 070000 means 7.0.0

As can be seen, when Matlab starts using HG2 (perhaps in 2011?), the top-level structure node will be called “hgS_080000″, indicating Matlab 8.0. QED.

As a side-note, note that in HG2/Matlab8, although the comment about using ‘all’ indicates that it has been removed, in practice it is still accepted (although not being used). This will enable your code to be backward-compatible whenever HG2 launches, and future-compatible today.

Have you used handle2struct or struct2handle? If so, please share your experience in a comment.

Let the upcoming 2011 be a year filled with revelations, announcements and fulfillment! Happy New Year everybody!

 
Related posts:
  1. Matlab layout managers: uicontainer and relatives Matlab contains a few undocumented GUI layout managers, which greatly facilitate handling GUI components in dynamically-changing figures....
  2. Matlab and the Event Dispatch Thread (EDT) The Java Swing Event Dispatch Thread (EDT) is very important for Matlab GUI timings. This article explains the potential pitfalls and their avoidance using undocumented Matlab functionality....
  3. Types of undocumented Matlab aspects This article lists the different types of undocumented/unsupported/hidden aspects in Matlab...
  4. FIG files format FIG files are actually MAT files in disguise. This article explains how this can be useful in Matlab applications....
 

getundoc – get undocumented object properties

$
0
0

Last week, I presented the list of undocumented properties available in Matlab’s cursor mode and data-tip objects. Over the past two years, I had posted quite a few other articles on this website that used such undocumented properties. So today I will show exactly how such properties can be discovered.

Hidden properties are object properties that for some reason or other MathWorks has decided not to expose to the general public. They can still be used by Matlab users, just like any other regular property. But if you use the built-in get and set functions to list the object’s properties, you will not find the hidden properties listed. You need to know the hidden properties’ exact name in order to use them. Which is where today’s post can help, by showing you how to list these hidden properties. I wrote about this a couple of years ago, and today’s article will expand on that original post.

Hidden properties are by their very nature undocumented and not officially supported. For this reason, you should take extra care when relying on them in your code. They could change functionality or even be removed without prior notice in any future Matlab release. Still, some of these properties enable very important functionality, as I have often shown on this website.

HideUndocumented

There are two distinct manners by which undocumented properties can be seen in Matlab. The simplest was reported by Hans Olsson all the way back in 1997, in one of the very earliest posts on the CSSM newsgroup (there is no earlier public report, as far as I could tell). Since then, this method was mentioned in about a dozen other CSSM posts.

By setting the Matlab root (handle 0)’s HideUndocumented property to ‘off’ (default=’on’), subsequent calls to the built-in get and set functions list the hidden properties in addition to the regular ones. Note that HideUndocumented is itself a hidden property, which is why Hans’ post is so important – he presented us with the loose end that then enabled us to untangle the hidden properties in any other HG object.

Here is a simple example, showing HideUndocumented‘s effect on the root (handle 0) object handle itself (hidden properties are highlighted):

% Display only regular properties
>> get(0)
	CallbackObject = []
	CommandWindowSize = [86 51]
	CurrentFigure = []
	Diary = off
	DiaryFile = diary
	Echo = off
	FixedWidthFontName = Courier New
	Format = longG
	FormatSpacing = compact
	Language = he_il
	MonitorPositions = [ (2 by 4) double array]
	More = off
	PointerLocation = [1084 590]
	RecursionLimit = [500]
	ScreenDepth = [32]
	ScreenPixelsPerInch = [96]
	ScreenSize = [1 1 1440 900]
	ShowHiddenHandles = off
	Units = pixels
 
	BeingDeleted = off
	ButtonDownFcn = 
	Children = []
	Clipping = on
	CreateFcn = 
	DeleteFcn = 
	BusyAction = queue
	HandleVisibility = on
	HitTest = on
	Interruptible = on
	Parent = []
	Selected = off
	SelectionHighlight = on
	Tag = 
	Type = root
	UIContextMenu = []
	UserData = []
	Visible = on
 
% Display ALL properties (including hidden ones, which are highlighted below)
>> set(0,'HideUndocumented','off')
>> get(0)
	BlackAndWhite = off	CallbackObject = []
	CommandWindowSize = [86 51]
	CurrentFigure = []
	Diary = off
	DiaryFile = diary
	Echo = off
	ErrorMessage = [ (1 by 79) char array]	FixedWidthFontName = Courier New
	Format = longG
	FormatSpacing = compact
	HideUndocumented = off	Language = he_il
	MonitorPositions = [ (2 by 4) double array]
	More = off
	PointerLocation = [1022 82]
	PointerWindow = [0]	RecursionLimit = [500]
	ScreenDepth = [32]
	ScreenPixelsPerInch = [96]
	ScreenSize = [1 1 1440 900]
	ShowHiddenHandles = off
	Units = pixels
	AutomaticFileUpdates = on 
	BeingDeleted = off
	PixelBounds = [0 0 0 0]	ButtonDownFcn = 
	Children = []
	Clipping = on
	CreateFcn = 
	DeleteFcn = 
	BusyAction = queue
	HandleVisibility = on
	HelpTopicKey = 	HitTest = on
	Interruptible = on
	Parent = []
	Selected = off
	SelectionHighlight = on
	Serializable = on	Tag = 
	Type = root
	UIContextMenu = []
	UserData = []
	ApplicationData = [ (1 by 1) struct array]	Behavior = [ (1 by 1) struct array]	Visible = on
	XLimInclude = on	YLimInclude = on	ZLimInclude = on	CLimInclude = on	ALimInclude = on	IncludeRenderer = on

Property definitions

An entirely different mechanism uses the schema.prop definitions that were presented here by Donn Scull at the beginning of 2011. The idea is to get the object’s classhandle reference, from it to get the list of properties definitions, and for each property look at its Visible meta-property: hidden properties will simply have Visible=’off’, whereas regular properties will have ‘on’.

It turns out that there is not always a full correspondence between these two mechanism. I can’t remember specific examples, and perhaps these were fixed in the latest Matlab releases. It doesn’t matter, because merging the list of hidden properties reported by these two methods is always safe to do. Which is exactly what my getundoc utility does:

getundoc utility

The getundoc utility is based on another utility by the same name, posted by Duane Hanselman to the Matlab File Exchange in 2006 (Duane has elected to remove all his submissions from FEX a year or two ago, but that’s an entirely separate [and extremely heated] topic for a different discussion). Duane’s original getundoc utility relied only on the first (HideUndocumented) mechanism.

I have since expanded this utility to include support for the second mechanism, as well as support for the upcoming HG2 (see below). The updated getundoc is now available for download on the File Exchange. Since it’s a very short utility, I will digress from my norm and simply present its code, in its present form, here:

function c = getundoc(arg)
%GETUNDOC Get Undocumented Object Properties.
% GETUNDOC('OBJECT') or GETUNDOC(H) returns a structure of
% undocumented properties (names & values) for the object having handle
% H or indentified by the string 'OBJECT'.
%
% For example, GETUNDOC('axes') or GETUNDOC(gca) returns undocumented
% property names and values for the axes object.
 
% Extension of Duane Hanselman's original utility (which is no longer
% available on the File Exchange):
% D.C. Hanselman, University of Maine, Orono, ME 04469
% MasteringMatlab@yahoo.com
% Mastering MATLAB 7
% 2006-01-06
 
if nargin~=1
   error('One Input Required.')
end
if ischar(arg) % GETUNDOC('OBJECT')
   switch lower(arg)
   case 'root'                                                       % root
      h=0;
      hf=0;
   case 'figure'                                                   % figure
      h=figure('Visible','off');
      hf=h;
   otherwise                          % some other string name of an object
      hf=figure('Visible','off');
      object=str2func(arg);
      try
         h=object('Parent',hf,'Visible','off');
      catch
         error('Unknown Object Type String Provided.')         
      end
   end
elseif ishandle(arg) % GETUNDOC(H)
   h=arg;
   hf=0;
else
   error('Unknown Object Handle Provided.')
end
 
wstate=warning;
warning off                                      % supress warnings about obsolete properties
try set(0,'HideUndocumented','off'); catch; end  % Fails in HG2
undocfnames=fieldnames(get(h));                  % get props including undocumented
try set(0,'HideUndocumented','on'); catch; end   % Fails in HG2
docfnames=fieldnames(get(h));                    % get props excluding undocumented
 
% Yair 18/3/2010 - add a few more undocs:
try
    % This works in HG1
    props = get(classhandle(handle(h)),'properties');
    undocfnames = [undocfnames; get(props(strcmp(get(props,'Visible'),'off')),'Name')];
catch
    % Yair 18/9/2011: In HG2, the above fails, so use the following workaround:
    try
        prop = findprop(handle(h),undocfnames{1});
        props = prop.DefiningClass.PropertyList;
        undocfnames = [undocfnames; {props.Name}'];   % {props([props.Hidden]).Name}
    catch
        % ignore...
    end
end
 
c = setdiff(undocfnames,docfnames);      % extract undocumented
 
% Get the values in struct format, if relevant
if ~isempty(c)
  s = struct;
  for fieldIdx = 1 : length(c)
      try
          fieldName = c{fieldIdx};
          s.(fieldName) = get(h,fieldName);
      catch
          s.(fieldName) = '???';
      end
  end
  c = s;
end
% Yair end
 
if hf~=0                     % delete hidden figure holding selected object
   delete(hf)
end
warning(wstate)

Usage of this utility is extremely simple:

>> getundoc(0)
ans = 
             ALimInclude: 'on'
         ApplicationData: [1x1 struct]
    AutomaticFileUpdates: 'on'
                Behavior: [1x1 struct]
           BlackAndWhite: 'off'
             CLimInclude: 'on'
            ErrorMessage: [1x79 char]
            HelpTopicKey: ''
        HideUndocumented: 'on'
         IncludeRenderer: 'on'
             PixelBounds: [0 0 0 0]
           PointerWindow: 0
            Serializable: 'on'
             XLimInclude: 'on'
             YLimInclude: 'on'
             ZLimInclude: 'on'
 
>> getundoc(gcf)
ans = 
               ALimInclude: 'on'
    ActivePositionProperty: 'position'
           ApplicationData: [1x1 struct]
              BackingStore: 'on'
                  Behavior: [1x1 struct]
               CLimInclude: 'on'
                CurrentKey: ''
           CurrentModifier: {1x0 cell}
                 Dithermap: [64x3 double]
             DithermapMode: 'manual'
              DoubleBuffer: 'on'
            ExportTemplate: []
               FixedColors: [3x3 double]
                   HelpFcn: ''
              HelpTopicKey: ''
              HelpTopicMap: ''
           IncludeRenderer: 'on'
                 JavaFrame: [1x1 com.mathworks.hg.peer.HG1FigurePeer]
               MinColormap: 64
             OuterPosition: [436 374 568 502]
               PixelBounds: [0 0 560 420]
             PrintTemplate: []
              Serializable: 'on'
                    UseHG2: 'off'
                WaitStatus: []
               XLimInclude: 'on'
               YLimInclude: 'on'
               ZLimInclude: 'on'

Fixes for HG2

Unfortunately, in the new HG2 (which is still not in production, but we must be prepared, mustn’t we?), the original mechanism above (HideUndocumented) fails completely (there is no such property in the new matlab.ui.root object), whereas the second mechanism (UDD property defs) needs to be modified: Apparently, classhandle fails for HG2 object handles. Instead, we use the workaround of using findprop to get the property definition for any regular property, then get its parent (the requested class definition), and then down again to list all available properties. Note that in HG2, the relevant meta-property is Hidden which holds logical (true/false) values, as opposed to Visible and ‘off’/'on’ values for HG1 above.

All of these fixes are now incorporated in the getundoc code that is listed above.

When comparing the list of hidden properties in the existing HG1 and the new HG2, we see many interesting differences. And yes: the figure’s JavaFrame property was indeed removed in HG2. Bummer! (don’t worry – there are several workarounds up my sleeve…)

Do you have any favorite hidden property that you use in your code? If so, please tell us about it in a comment below.

p.s. – For all the numerous good people telling me about cprintf – Yes: I am aware that the latest R2011b release has broken cprintf‘s functionality. I plan to release a workaround sometime soon, when I have some spare time. I’ll keep everybody posted of course. Please be patient. (if you can’t wait, you can always hire me to fix it sooner; otherwise I need to give priority to my paying clients…)

 
Related posts:
  1. Undocumented cursorbar object Matlab's internal undocumented graphics.cursorbar object can be used to present dynamic data-tip cross-hairs...
  2. Accessing private object properties Private properties of Matlab class objects can be accessed (read and write) using some undocumented techniques. ...
  3. UDD Properties UDD provides a very convenient way to add customizable properties to existing Matlab object handles...
  4. Plot LimInclude properties The plot objects' XLimInclude, YLimInclude, ZLimInclude, ALimInclude and CLimInclude properties are an important feature, that has both functional and performance implications....
 

Matlab installation take 2

$
0
0

It’s that time of the year again. With Matlab 8.0 (R2012b) now available for download, I once again installed a new release. Today’s post will detail some of the post-installation steps I did for the new installation to work properly, for me at least. Nothing special compared to past releases, but worth listing anyway I guess. I won’t bother repeating the list that I published here exactly one year ago.

Removing extra files

Since my complaint last year, I see that some (not all) of the Japanese-language files have been removed from the installation. This is good, although some large Japanese files remain (e.g., the installation guide PDF and many help files) which a smart installer (or even better – the JNLP downloader) might know to ignore based on my computer’s locale.

In any case, what has been added to my dislike, are files in Chinese, specifically the helpsearch_zh_CN folder in %matlabroot%/help/ and %matlabroot%/help/matlab/, each weighing a hefty 14MB. I really hate giving Matlab the adjective of “bloatware”, but its releases keep getting larger and large (R2012b weighs over 800MB!) and I feel that a lot of it, like these Chinese files, could be avoided with only a little bit of extra care on the part of MathWorks. Not all computers have 100GB of free disk space, you know…

Modifying some Matlab m-files

I have several standard changes that I often make to Matlab files. These changes are naturally not propagated when installing a new Matlab release. I can understand this and I’m not complaining. I just need to go over the list of functions and re-modify them:

  1. profview and matlab-report-styles.css (both in %matlabroot%/toolbox/matlab/codetools/) – I’ll post a separate article about this next week, together with some additional undocumented profiling options that I did not cover in my previous article on this topic.
  2. uitree, uitab and other semi-documented functions (mostly in %matlabroot%/toolbox/matlab/uitools/) such as the useful hgfeval – add a % character at the beginning of line #3, in order to make the help section become visible during help or doc.

Preferences, workspace

This is one step that I do not need to do when installing on a machine having a previous Matlab installation. The installer is smart enough to detect that installation and copy its preference files to the new installation. However, updating the default preferences is indeed necessary for a fresh install, and since I was asked about this I thought to include this here.

So here are the changes that I normally make to the default preferences:

  1. General – Confirmation Dialogs – uncheck several confirmations
  2. General – Java Heap Memory – increase to 256 or 512MB
  3. Keyboard – check the <Tab key narrows completion> option (most useful for the desktop – see related article)
  4. Fonts – Monospaced 10pt => Courier New 8pt (the Monospace font is often displayed incorrectly, as a proportional rather than fixed-width font. Using Courier solves this problem. 8pt gives me more real-estate and still looks good on my display)
  5. Colors – Programming Tools – check all the options except <Show lines between sections>
  6. Command Window – Text display: long g compact; uncheck <Show getting started msg>; scroll buffer: 5K=>25K (will MathWorks ever increase this hard-coded limit?!)
  7. Editor – Most recently used (MRU): 4=>12 (until recently Matlab only supported 9, hurray)
  8. Editor – Display – check all options (on some older releases the <Show lines between sections> was here and needed to be unchecked; this option is now in Colors – programming Tools); Show line at 75 => 120 columns
  9. Editor – Tab – check all options
  10. Editor – Language – Max column width: 75 => 120; Indent all functions (not just nested)
  11. Editor – Code Folding – check all options in the <Enable> column; check most options in the <Fold Initially> column
  12. Editor – Autosave – Append file name with asv => ~
  13. GUIDE – uncheck all options except <Show file extension in window title>

And in the Workspace panel, only show the Name, Value, Bytes and Class columns (right-click the column headers to select).

A few words about R2012b

The new R2012b release has received the version ID of 8.0. Despite my speculations in 2010 (here and here) that Matlab 8.0 will bring along the promise of the much-awaited HG2, it turns out that I was incorrect. The new release still does not incorporate HG2. We can see a gradual progression in the work by starting Matlab with the “-hgVersion 2″ switch that I described there, but this has still not made it into the mainstream figure window. Hopefully we will get HG2 sometime next year.

R2012b does include a major facelift to the Desktop and Editor, using the new MS-Office-like toolstrip that I exposed here last year. Some people hate toolstrips, some love them, but whatever your personal preference is, Matlab does not have an option to switch back to the non-toolstripped appearance, so for good or worse we’re stuck with the new look. The new toolstrip is currently shown only in the Desktop and related tools, not in figure windows (perhaps in anticipation for HG2? I don’t know). Which reminds me that it’s really about time for me to write a detailed technical article explaining how to add a toolstrip to figure windows.

Another thing you’ll notice in the new release is a facelift to the documentation and the Matlab browser (tabs, finally!), along with a Quick Access Bar (QAB) and a Win7-like current-folder combo-box control.

Matlab's new look (click to zoom)

Matlab's new look (click to zoom)

One specific new features that readers of this blog (I, for one) will probably bless, is the ability to create a custom user Java static classpath and librarypath files, that will override and extend Matlab’s auto-generated classpath.txt and librarypath.txt files. The new custom files should be called javaclasspath.txt, javalibrarypath.txt and be placed in your prefdir or startup folder (the latter is useful for deployed applications). This finally puts an end to the need to update these files for each Matlab release, along with the ensuing compatibility problems that arose from incompatible set of Matlab JAR files. This solves a very painful operational issue for me and I’m sure that also for others.

Another Java-related improvement is the ability to get the underlying Java exception object in the catch part of a try-catch block. Not a biggie for me, but certainly a nice-to-have.

Sadly, if you’re looking for really important engine upgrades, then I haven’t found any that really caught my eye in the release notes. Maybe next year…

 
Related posts:
  1. Matlab installation woes Matlab has some issues when installing a new version. This post discusses some of them and how to overcome them....
  2. Accessing the Matlab Editor The Matlab Editor can be accessed programmatically, for a wide variety of possible uses - this article shows how....
  3. JGit-Matlab integration JGit source-control integration package can easily be integrated in Matlab. ...
  4. EditorMacro – assign a keyboard macro in the Matlab editor EditorMacro is a new utility that enables setting keyboard macros in the Matlab editor. this post details its inner workings....
 

HG2 update

$
0
0

Exactly three years ago, I posted information (here and here) about Matlab’s upcoming new graphics engine, so-called HG2 (Handle Graphics version 2). At the time, I was sure that HG2 was just around the corner. But three years and six releases have passed, Matlab 7 turned into Matlab 8, and HG1 is still in use. I decided that it was time to revisit the latest state of HG2, as reflected in the latest release, R2013a (Matlab 8.1).

In the past few years, development of HG2 has apparently progressed to a stage where most of the kinks were ironed out. The latest HG2 appears to be quite stable, and in my experience most GUI/graphics utilities run as-is, without any need for tweaking. This is good news, which leads me to think that HG2 will be released soon. It is possible that this could happen as early as the upcoming release (R2013b, 8.2) but I have a gut feeling that it will be in R2014a. I also have a gut feeling that MathWorks will name that release 9.0 rather than 8.3, in keeping with its arch-rival Mathematica.

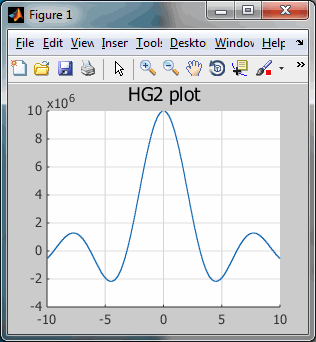
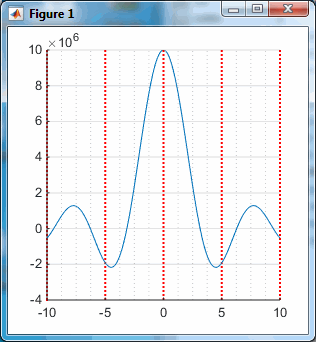
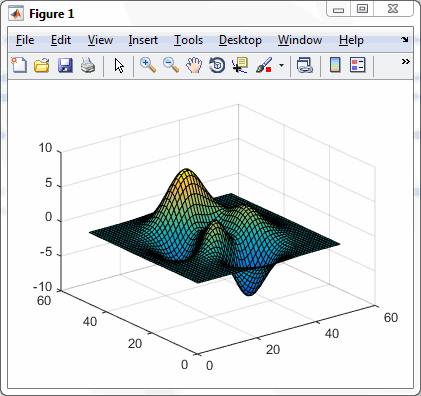
HG2 has improved grid lines, plot anti-aliasing and customizable everything (more on this below). Here’s a simple plot line as it appears in both HG1 and HG2:

hFig = figure('pos',[100,100,300,250]);
x = -10:0.1:10;
y = 1e7*sin(x)./x; 
hLine = plot(x,y);
box off; grid on;
title('HG2 plot');

HG1 plotHG2 plot

Same plot in HG1 and HG2

We can see that MathWorks has invested heavily in improving usability. The graphics are now much more visually appealing than before. A lot of thought has gone into small details such as the plot colors and the axes gray shades. The changes are small when taken separately, but the overall gestalt is striking. HG2 will definitely justify my license maintenance cost.

Highly customizable

Matlab in HG2 mode acts and behaves pretty much as you would expect. There are no visible changes to the Desktop or the graphics interface. The major difference is that all graphics handles, whether interactive controls (figure, uicontrols, uitables, etc.) or graph elements (axes, lines, patches, etc.) are instances of class objects (e.g., matlab.ui.Figure or matlab.graphics.chart.primitive.Line) rather than numeric values. This makes it easy to issue commands such as:

hFig.Color = 'w';
 
hAxes = gca;
hAxes.Title.Color = 'm';  % default: [0,0,0] = black
hAxes.YRuler.SecondaryLabel.String = 'millions';  % original: 'x10^{6}'
hAxes.YRuler.SecondaryLabel.FontAngle = 'italic';  % default: 'normal'
hAxes.YRuler.Axle.LineStyle = 'dotted';  % default: 'solid'
hAxes.YRuler.Axle.ColorData = uint8([0,100,0,255])';  %=dark green; default: [51 51 51 255], corresponding to [0.2 0.2 0.2 1]
hAxes.YBaseline.Color = 'b';  % default: [0.2 0.2 0.2]
hAxes.YBaseline.Visible = 'on';  % default: 'off'
hAxes.XRuler.Axle.Visible = 'off';  % default: 'on'
 
hLine.Color = [1,0,0];  %='red'

rather than using the corresponding set(…) or get(…) functions, which are still supported for backward compatibility.

Customized HG2 plot

Customized HG2 plot

Notice how much more customizable HG2 is compared to HG1. I am pretty excited from the huge number of additional possible customizations in HG2 compared to HG1. It is real a pity that many of these customizations rely on hidden/undocumented properties (see below). Hopefully this will change when HG2 is officially released.

Some observations

Here are a few observations that I collected on the latest HG2, as reflected in R2013a:

  1. Java is still supported (hurray!). The warnings about the figure’s JavaFrame property becoming deprecated have fortunately not been fulfilled (hopefully never). All the Java-based GUI tricks shown on this blog and in my book still work, excluding some minor things here and there which are due to inter-release changes rather than to the new HG2 engine.
  2. In order to access the top-level Java Frame of a figure window, we now need to use javaFrame.fHG2Client rather than javaFrame.fHG1Client. The relevant code should now look something like this, in order to be fully-compatible with older Matlab releases:
    jFrame = get(handle(hFig), 'JavaFrame');
    try
        % This works up to R2011a
        jFrame.fFigureClient.setClientDockable(true);
    catch
        try
            % This works from R2008b and up, up to HG2
            jFrame.fHG1Client.setClientDockable(true);
        catch
            % This works in HG2
            jFrame.fHG2Client.setClientDockable(true);
        end
    end
  3. Anti-aliasing of plot elements (a.k.a. line -smoothing) is now ‘on’ by default (double hurray!). Apparently, MathWorks solved the problems with the existing undocumented LineSmoothing property. Still, for some unknown reason, LineSmoothing remains a hidden/undocumented property. Note that for some objects the property name is different. For example, the axes title (which is a text object of class matlab.graphics.primitive.Text) has a new property called Smoothing that controls anti-aliasing (unlike LineSmoothing, Smoothing appears to be an un-hidden fully-documented property).
    R2013b addendum: The figure handle now includes a property called GraphicsSmoothing that controls anti-aliasing at the entire figure level (default=’on’). No more need to set individual graphic elements, although we still can if we want (alas, this flexibility may be removed soon – see item #6 below). I would have liked to see the anti-aliasing feature use the same property name for all graphic elements, rather than GraphicsSmoothing/LineSmoothing/Smoothing, but maybe I’m just being an ungrateful spoil-sport… The good news about GraphicsSmoothing is that this is a non-hidden property. This means it can be seen with get(gcf) and once HG2 becomes live it will become fully documented/supported – hurray!
  4. Many new properties have been added to graphic objects, that enable customization of different aspects. For example, we can customize the axes grid-lines, containing box and exponent labels in ways that were impossible in HG1 (triple hurray!). Note that many of these new properties are hidden/undocumented (why the hell for???), so we need a utility such as my uiinspect or getundoc to detect them. Some of the useful new axes properties include *Ruler, *Baseline, *GridHandle, BoxFrame and BackDrop (I showed an example usage of *Ruler and *Baseline above). I have absolutely no idea why these so-useful properties are kept hidden, it simply makes no sense.
  5. Some existing HG1 properties are missing. For example, the UserData property is no longer available for some Java objects (this is a real pity — I depended on it for many functionalities, such as storing node-specific data in uitree/JTree nodes). Similarly, axes no longer have *LimInclude properties (this actually makes sense – these properties are still available in plot lines, where they actually have a use).
  6. Some existing HG1 properties now issue a warning, although they still work. For example:
    >> hAxes.DrawMode = 'fast';
    Warning: The DrawMode property will be removed in a future release.
    (Type "warning off MATLAB:hg:willberemoved" to suppress this warning.) 
     
    >> hLine.LineSmoothing
    Warning: The LineSmoothing property will be removed in a future release.
    (Type "warning off MATLAB:hg:willberemoved" to suppress this warning.) 
    ans =
    on

    R2013b addendum: hAxes.DrawMode no longer issues a warning, although hLine.LineSmoothing does.

  7. There is an open bug on R2012b and R2013a whereby the clf function does not delete javacomponent objects. This bug does not affect HG2, where clf works properly.
  8. Some GUI components are being placed a pixel or two sideways in HG2 compared to HG1. This has no visual importance except in very rare cases, but it does affect my findjobj utility, which relies on the component’s position to find its underlying Java object. I have updated findjobj for the upcoming HG2 and it should work with both HG1 and HG2.
  9. The default axes and labels color has changed from black to gray ([0.2 0.2 0.2]). Grid lines now use an even lighter gray shade. Visually I think that this is a great change, since it directs the viewer’s focus on the plot contents rather than the external decorations.
  10. The default axes plot color order has changed. The standard plot color is no longer blue (as it was for ages in Matlab), but a bluish tint; the second color is no longer red but light green; the third color is reddish rather than dark green, etc.:
    % HG1
    >> get(0,'defaultAxesColorOrder')
    ans =
                0            0            1
                0          0.5            0
                1            0            0
                0         0.75         0.75
             0.75            0         0.75
             0.75         0.75            0
             0.25         0.25         0.25
     
    %HG2
    >> get(0,'defaultAxesColorOrder')
    ans =
         0.070588      0.40784      0.70196
          0.92941      0.14118      0.14902
          0.60784       0.7451      0.23922
          0.48235      0.17647       0.4549
                1      0.78039            0
          0.30196       0.7451      0.93333
          0.82353       0.4549            0

    R2013b addendum: The default colors have changed a bit (for the better I think). I still think that the relative order should more closely match the current order (blue-green-red-etc.), for compatibility with existing apps. A small utility function could be added that modifies the color-order to something that may be better suited for color-differentiation (see Tim Holy’s excellent utility for an example).

  11. HG2 axes no longer forget the previous plot color (unless we used hold all) — in HG2 color cycling is on by default. Note that this causes some visual discrepancies between HG1 and HG2 in plots that use hold on and have multiple plot lines: In HG1 they were all blue; in HG2 the first is bluish, the second is greenish, then reddish etc.
  12. GUIDE is still the same-ol’ GUIDE (sigh!). The figure toolbar and menubar have likewise not been upgraded, as far as I could tell.
  13. HG2 performance appears to be generally slower than HG1. Hopefully this will improve by the time HG2 is released, since performance has been one of HG1′s drawbacks all along. In my tests, most GUI/graphic aspects ran only slightly slower in HG2, except for 2D plots that were significantly slower. This is corroborated by running bench: on my computer, HG1 yields 0.4 for 2D and 0.22 for 3D; in HG2 the performance is 2.1 for 2D and 0.18 for 3D. Looks like the 2D performance still needs some work…

Testing HG2

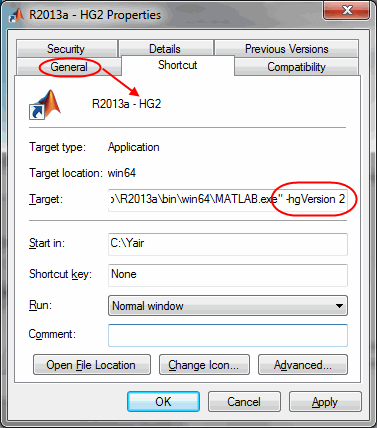
As noted in my original article, we can start Matlab in HG2 mode by simply adding the startup (command-line) switch -hgVersion 2 to the Matlab command (note the space between the -hgVersion and the “2″). For example, in Windows, all you need to do is to copy your Matlab shortcut sideways (so that you will always have the standard HG1 version available), then right-click the shortcut, select “Properties”, then add -hgVersion 2 to the Target field (note the space between “hgVersion” and “2″). You will probably want to also add the “HG2″ descriptor to the shortcut name, in the “General” tab:

Matlab startup switch for HG2

Matlab startup switch for HG2

If you have any Matlab application that relies on GUI or graphics, I urge you to test it on the new HG2 system. It’s trivially simple and your application should work exactly the same, or better. If you do detect some incompatibility, please post a comment or shoot me an email. In due course I expect that MathWorks will open an official channel for this, but in the meantime I’ll be sure to pass the information to the relevant person.

Do take a moment for testing HG2 – we can all contribute to ensure that when HG2 does come out it will be perfect. It’s in our interest.

NYC visit

If you happen to be in New York next week, I urge you to attend the MATLAB Computational Conference on Thursday May 23 (free registration; my presentation is scheduled for 4:50pm). I would be happy to meet you to discuss how I could bring value to your needs, either financial-oriented or not. We could meet at the conference, or anywhere in New York on Wednesday May 22 or Friday May 24.

Matlab Computational Finance Conference - 23 May 2013

 
Related posts:
  1. Plot LimInclude properties The plot objects' XLimInclude, YLimInclude, ZLimInclude, ALimInclude and CLimInclude properties are an important feature, that has both functional and performance implications....
  2. FIG files format FIG files are actually MAT files in disguise. This article explains how this can be useful in Matlab applications....
  3. Panel-level uicontrols Matlab's uipanel contains a hidden handle to the title label, which can be modified into a checkbox or radio-button control...
  4. Performance: accessing handle properties Handle object property access (get/set) performance can be significantly improved using dot-notation. ...
 

Waterloo graphics beta

$
0
0

Once again I’d like to welcome guest blogger Malcolm Lidierth of King’s College London. Malcolm has written several articles here, including a couple of articles on his Waterloo graphing library. Today, Malcolm discusses new features in this library, as it matures into an official beta phase.

Waterloo contour plot of Matlab's penny image

Waterloo contour plot of Matlab's penny image

Last year, Yair kindly allowed me space for a couple of guest blogs on the Waterloo graphics open-source project. Waterloo has recently transitioned to a ‘beta’ release status, with several new features – many of them in response to suggestions from readers of this blog. Many thanks to all who made those.

One of the motivations in writing Waterloo was to get better, less pixellated graphs in Matlab. By using Java 2D, the core library is not tied to Matlab. Waterloo graphics can be used wherever there is access to a Java Virtual Machine: R, ScilLab etc. MathWorks obviously feel the need for better graphics too: Yair recently blogged about the next generation Matlab graphics (HG2). The Waterloo beta release provides support for mixing both Waterloo graphs and Matlab HG2 graphs in a single figure (as well as current HG1 graphics of course).

The new features in the Waterloo beta can be summarized as:

  1. Introducing new plot types: contours, bars, polar and area charts
  2. Mouse-selectable regions of interest
  3. Support for fast-plot updates without redrawing the entire graph
  4. Support for web-deployment of the graphs using SVG or Processing and ProcessingJS

Today I will concentrate on [1] and [2], illustrated with some Matlab examples; I will discuss [3] and [4] next week.

Installation of Waterloo in Matlab

For those readers who have not yet installed Waterloo in Matlab, the process is very simple: download the latest zip file and extract it. All the sub-folders in the waterloo folder are needed but only the Waterloo_MATLAB_Library subfolder (not its subfolders) should be added to the Matlab path. Once installed, just type waterloo at the Matlab prompt in each Matlab session.

A Matlab script file that will do it all is available here (Waterloo_installer.m). The script is harmless to run if you already have Waterloo installed, but if not then it will automatically find the latest zip file on SourceForge, download and install it, and then configure the Matlab path appropriately.

Contour plots

I ended my last guest article with an example of work-in-progress: filled contours. The beta release now fully supports these.

Recall from the previous articles that GXFigure creates a Waterloo-compatible Matlab figure window. gxgca() returns a reference to the container for the graph as a Matlab GXGraph object, much as Matlab’s built-in gca returns an axes reference.

Here is Matlab’s Lincoln penny demo in Waterloo:

% Get some pre-defined colors
colors = [kcl.waterloo.defaults.Colors.getColor(0)];
for k = 1 : 17
    colors = horzcat(colors,kcl.waterloo.defaults.Colors.getColor(k));
end
 
f = GXFigure();
set(gcf, 'Name','Filled Contour', 'Units','normalized', 'Position',[0.3 0.3 0.4 0.4])
 
load penny;
ax = subplot(f,1,1,1);
ax.getObject().setAspectRatio(1);
p2 = contourf(ax, flipud(P), 18, 'LineStyle','-', 'LineWidth',0.4);
p2.getObject().setFillClipping(false);
p2.getObject().setFill(colors);
drawnow();

(resulting in the contour plot above)

To transform Abe Lincoln to a logarithmic world, just double-click the graph and select the log transform. The result is shown on the right here:

Transformed Matlab penny image

Transformed Matlab penny image

All plots in Waterloo share a common data model, including contour plots. For a scatter plot, x, y pairs in a set represent the offsets to display a marker e.g. a circle or square that is generally of fixed size. For a contour plot, the marker is the contour line and the values for that incorporate the offsets. The xdata and ydata are added during plotting; while these will normally be zero, this makes it trivial to construct montages of contour plots simply by using non-zero values.

Plainly, this needs some extra work to support the common model: circles for a scatter plot are still painted as fixed diameter circles when the plot is rescaled or transformed but the pixel values for a contour line, bar plot etc will need to be recalculated. To achieve this:

  • the data model incorporates an extra object to do the work
  • such plots implement a new interface – GJTransformUpdateInterface – that specifies a transformUpdate() method that refreshes the pixel-coordinates. End-users will not normally need to concern themselves with this, as transformUpdate method will be called by the listeners as required.

Categorical data

Waterloo always uses numeric data to position markers, bars etc in a plot. However, categorical data can be used to supplement those data. Here is an example using the new bar plot:

Categorized Waterloo bar plot Categorized Waterloo bar plot

Categorized Waterloo bar plots

f = GXFigure();
set(gcf, 'Name','TestBar4', 'Units','normalized', 'Position',[0.1 0.1 0.8 0.8]);
m = {'Jan', 'Feb', 'March', 'April', 'May', 'June', 'July', 'Aug', 'Sept', 'Oct', 'Nov', 'Dec'};
gr1 = subplot(f, 2, 2, 1);
a = bar(gr1, 1:12, 1:12);
for k = 1 : 12
   a.getObject().getDataModel().getXData().setCategory(k, m{k});
end
gr1.getObject().setTitleText('Label using the XData categories');
gr1.getObject().getView().autoScale();

Support for categorical labels on the axes is supported for all plots via the common data model. For bar charts, the extra object associated with the plot also supports adding labels to the bars themselves:

f = GXFigure();
set(gcf, 'Name','Categorized Bars', 'Units','normalized', 'Position',[0.3 0.3 0.4 0.4]);
m = {'Jan', 'Feb', 'March', 'April', 'May', 'June', 'July', 'Aug', 'Sept', 'Oct', 'Nov', 'Dec'};
gr = subplot(f, 1, 1, 1);
c = barh(gr, 1:10, 1:10,'stacked');
c.getObject().setFill([java.awt.Color.yellow, java.awt.Color.blue]);
c.getObject().getDataModel().getExtraObject().setFontForeground([java.awt.Color.BLACK, java.awt.Color.WHITE]);
for k = 1 : 12
   c.getObject().getDataModel().getExtraObject().getLabels().add(k-1, m{k});
end
gr.getObject().getView().autoScale();

Note that the standard method setFill, is used to set the bar colors and as two colors are supplied the data are assumed to contain a pair of multiplexed series. This is common to all plots.

To customize the labels, we need to set a property in the extra object which is retrieved with a call to c.getObject().getDataModel().getExtraObject().

The same principles apply to pie charts:

Labelled Waterloo pie chart

Labelled Waterloo pie chart

f = GXFigure();
set(gcf, 'Name','TestPie1', 'Units','normalized', 'Position',[0.1 0.1 0.8 0.8]);
colors = [kcl.waterloo.defaults.Colors.getColor(0)];
y = ones(1,18)*100/18;
gr = subplot(f, 1, 1, 1);
colors = [kcl.waterloo.defaults.Colors.getColor(1),...
    kcl.waterloo.defaults.Colors.getColor(17),...
    kcl.waterloo.defaults.Colors.getColor(2),...
    kcl.waterloo.defaults.Colors.getColor(16),...
    kcl.waterloo.defaults.Colors.getColor(3),...
    kcl.waterloo.defaults.Colors.getColor(15),...
    kcl.waterloo.defaults.Colors.getColor(4),...
    kcl.waterloo.defaults.Colors.getColor(14)];
c = pie(gr, [10 20 45 42 22 26 42 20], logical([0 0 1]), 'FaceColor',colors);

Polar charts

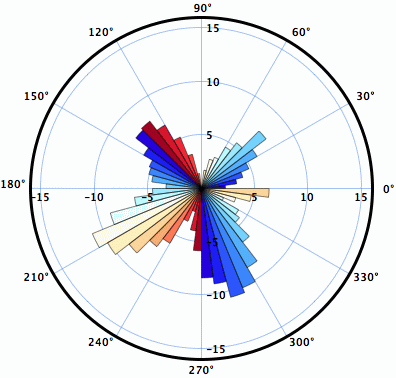
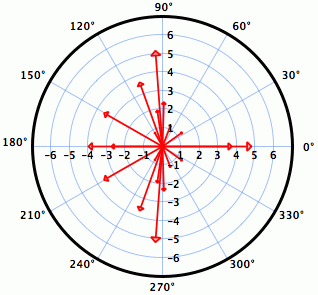
Polar bar and compass charts are also now supported:

Waterloo polar bar chart (click for details)Waterloo compass chart (click for details)

Waterloo polar bar and compass charts (click for details)

f = GXFigure();
set(gcf, 'Name','TestPie1', 'Units','normalized', 'Position',[0.1 0.1 0.8 0.8]);
load sunspot.dat  % Contains a 2-column vector named sunspot
colors = [kcl.waterloo.defaults.Colors.getColor(0)];
for k = 1 : 17
    colors = horzcat(colors,kcl.waterloo.defaults.Colors.getColor(k));
end
gr1 = subplot(f, 1,2, 1);
a = polarbar(gr1, sunspot(1:48,2), 'FaceColor',colors, 'EdgeWidth',0.5);
 
[a,b] = hist(sunspot(:,2),12);
gr2 = subplot(f, 1,2, 2);
b = polarbar(gr2, a, 'FaceColor',colors);
 
Z = eig(randn(20,20));
a = compass(gr1, real(Z), imag(Z), 'LineColor','r');

Area plots

Area plots are supported through a new plot class and also by having all plots implement a new Java interface. To illustrate, create two line plots:

Waterloo area-fill chart

Waterloo area-fill chart

f = GXFigure();
set(gcf, 'Name','TestAreaFill', 'Units','normalized', 'Position',[0.4 0.1 0.5 0.4]);
x = 0.5 : 0.5 : 10;
y = sin(x);
gr1 = gxgca();
a1 = line(gr1, x, y, 'LineSpec','-ob');
b1 = line(gr1, x, y*2, 'LineSpec','-sg');
gr1.getObject().getView().autoScale();
 
% Filling the area between the two plots requires one extra line and a refresh call to paint the result:
a1.getObject().setAreaFill(b1.getObject());
refresh();

All the work is done in the Java code because plots now implement the GJFillable interface. All that is required is to call the setAreaFill() method on a class implementing GJFillable, specifying another GJFillable as input.

A new java class, GJFill, also implements GJFillable and can be used to fill an area relative to a scalar constant or an arbitrary shape. I have also written a Matlab wrapper class for this (GXFill, see below) but I shall use a Java-based example here.

Whether the fill is made horizontally (from the plot) or vertically (from the axes) can be selected by setting the orientation property of the GJFill instance. This can also be set to arbitrary, in which case we can create a custom fillable area sythesized from java.geom shapes:

Waterloo full area fill chart Waterloo custom area fill chart

Waterloo full (above) & custom (below) area fill charts

f = GXFigure();
set(gcf, 'Name','Constant Fill', 'Units','normalized', 'Position',[0.3 0.3 0.4 0.4]);
x = 0.5 : 0.5 : 10;
y = sin(x);
gr1 = subplot(f, 1, 1, 1);
a1 = line(gxgca, x+1, y+3, 'LineSpec','-sg');
 
% Now create a GJFill instance, using a constant as the reference (1.5 in this case), and use this as this area's fill
v = kcl.waterloo.graphics.plots2D.GJFill(a1.getObject(), 1.5);
a1.getObject().setAreaFill(v);
 
%% Start complex
   % Alternately, we can use an arbitrary fill shape:
   v.setOrientation(javaMethod('valueOf', 'kcl.waterloo.graphics.plots2D.GJFill$ORIENTATION', 'ARBITRARY'));
   a1.getObject().setAreaFill(v);
 
   % Create a shape (which can be complex)
   area = java.awt.geom.Area(javaObject('java.awt.geom.Rectangle2D$Double',1,1,5,5));
   area.add(java.awt.geom.Area(javaObject('java.awt.geom.Rectangle2D$Double',8,1,2,5)));
 
   % Add the shape to the GJFill instance
   v.setArbitraryArea(java.awt.geom.Area(area));
%% End complex
 
% Customize the fill color
v.setAreaPaint(java.awt.Color(0,1,0,0.5));
 
% Manually rescale and refresh the plot
gr1.getObject().getView().setAxesBounds(0,0,12,5);
refresh();

To make this simpler from Matlab, a new Matlab class GXFill is provided. This constructs and adds a fill in a single step:

fill = GXFill(plot_reference, value, orientation);

where value is a scalar or a Java Shape object, and orientation is a string e.g. ‘horizontal’. Note that the coordinates are specified in axes units and they will rescale and be transformed as needed when the axes are changed.

Specifying/selecting ROIs

Finally, regions of interest (ROIs) can be selected both programmatically and with the mouse. One of these can be set as the “current” ROI and that is the one that is mouse selectable: set the current ROI using shift-left mouse drag, set the region and rescale to display only that region using shift-right mouse drag.

To create an ROI that can be dragged and resized, add a GJRoi instance to the graph, e.g. with an existing current ROI selected:

gr = gxgca;
gr = gr.getObject().getView();
gr.add(kcl.waterloo.graphics.GJRoi.createInstance(gr, gr.getCurrentROI()));

Waterloo and Matlab’s Java support

Note: It appears that HG2, like HG1, creates an offscreen bitmap that is then blitted onto a Java Canvas within a Matlab figure. Matlab warns that the JavaFrame property will (no longer may) be discontinued in some future release, but it is my guess that this will not be the case when HG2 is released. A new set of uicontrols may indeed be included using a C-based library like wxWidgets or Qt. However, it seems unlikely that Java support will be dropped completely – too much of Matlab’s GUI uses Java (for example, the new desktop introduced in R2012b is entirely Java-based). So the Waterloo Matlab library should work, even if a switch is needed to using JFrames instead of Matlab figures for output.

For the adventurous, Waterloo graphs can also be deployed using JavaFX via the SwingNode class – but that requires installation of the latest Java 8 (currently in early release status). Noting that Matlab is still (as of R2013a) using Java 6, this may indeed be a big jump (note last week’s article on upgrading Matlab to use Java 7).

Naturally, Waterloo’s graphs and classes can also be used in stand-alone Java applications, entirely outside Matlab, even on a $30 ARM6 Raspberry Pi.

Next week, I will look at methods for animating plots (e.g. using Matlab timers) and deploying vector graphics to web pages using the in-built GUIs.

 
Related posts:
  1. Waterloo graphics Waterloo is an open-source library that can significantly improve Matlab GUI. ...
  2. Waterloo graphics examples Some Matlab usage examples for the open-source Waterloo graphics package. ...
  3. Waterloo graphics animation and web deployment Waterloo graphics can be updated very quickly in Matlab, enabling plot animation; web deployment of the graphics is also possible. ...
  4. Handle Graphics Behavior HG behaviors are an important aspect of Matlab graphics that enable custom control of handle functionality. ...
 

Draggable plot data-tips

$
0
0

A couple of years ago, I was asked by a client to figure out a way to make Matlab plot data-tips movable. The problem was that he had a very crowded plot and Matlab’s standard data-tips are displayed immediately adjacent to the data, thereby overlapping the plot parts. Matlab’s standard data-tips enable dragging to a very limited extent (only to the 4 corners of the data-point), and in any case the displayed textbox remains directly attached to the data point.

So I developed a small utility for my client that solves this problem. I then forgot all about it until a few days ago when I came across it again. Yesterday I uploaded this draggableDataTips utility to the File Exchange, where you can download it.

draggableDataTips enables the user to interactively drag any newly-created data-tip, anywhere in the Matlab figure. A dashed line connects the dragged data-tip with the original data point. Simple, intuitive, and effective. At 300 lines, the draggableDataTips.m source code is compact and easy to follow, and you’re welcome to take a look and further customize this utility for your specific needs.

draggableDataTips utility in action

draggableDataTips utility in action


Technical implementation

The implementation of draggableDataTips relies on undocumented aspects of the data-cursor object exposed via the datacursormode function. I have already shown how these can be used to customize and control data-tips programmatically (rather than interactively). For draggableDataTips, we first get the cursor object’s meta-data classhandle (a schema.class object), then use it to find the meta-data for its hidden CurrentDataCursor property (a schema.prop object). There is also a more direct approach, using the findprop function.

Whichever alternative we choose, we finally use this object to set the property’s SetFunction meta-property. Quite straight-forward, I should say:

% Get the cursor-mode object
cursorObj = datacursormode(hFig);
 
% Alternative #1: the indirect route to the meta-property
ch = classhandle(cursorObj);
hPropIdx = strcmpi(get(ch.Properties,'Name'), 'CurrentDataCursor');
hProp = ch.Properties(hPropIdx);
 
% Alternative #2: the direct approach
hProp = findprop(cursorObj, 'CurrentDataCursor');
 
% Update the meta-property to use a custom function whenever new data-tips are created
hProp.SetFunction = @installNewMoveFcn;

This has the effect that all new data-tips that will be created from then on will call our custom installNewMoveFcn function when the data-tip object is created. This installNewMoveFcn function, in turn, simply replaces the data-tips standard default callback for mouse movement (which is used while dragging), to a new custom function textBoxUpdateFcn:

% Install a replacement callback function for datatip textbox mouse movement
function hDataTip = installNewMoveFcn(cursorObj, hDataTip)
    srcObjs = get(hDataTip.SelfListenerHandles,'SourceObject');
    for srcIdx = 1 : length(srcObjs)
        if strcmpi(srcObjs{srcIdx}.Name,'Orientation')
            hDataTip.SelfListenerHandles(srcIdx).Callback = @textBoxUpdateFcn;
            hDataTip.MarkerHandle.Marker = 'none';
            break;
        end
    end
end

The textBoxUpdateFcn function basically moves the datatip textbox to the new mouse location, without limiting its positions as Matlab’s standard default callback function did. A dashed connector line is then drawn to connect the center of the textbox with the data-point. It’s a bit long to include here, but interested readers are welcome to look at the code (lines #99 onward in draggableDataTips.m).

As can be seen from the screenshot above, standard and draggable data-tips can be used in the same plot. This is done by simply turning the draggability functionality on and off by draggableDataTips before creating a new data-tip (using either alt-click or programmatically):

draggableDataTips on    % or: draggableDataTips('on')  or: draggableDataTips(true)
draggableDataTips off   % or: draggableDataTips('off') or: draggableDataTips(false)

Notes:

  1. The actual code of draggableDataTips naturally contains more sanity checks, exception handling etc. I have only presented the core code in the snippets above, but you should always include such extra checks in any real-life program.
  2. There is a minor bug that causes the connector line to be on top of the box rather than beneath it, but aside from this all works ok. For some reason, uistack did not work. If anyone has a fix for this bug, please let me know.
  3. Did you notice that Java was not mentioned anywhere above? Mode managers, such as the data-cursor mode, use pure-Matlab functionality.

HG2

Unfortunately, when I tested draggableDataTips on HG2, Matlab’s upcoming new graphics engine, the utility failed. Data-cursors have undergone a significant reengineering in HG2 (about time!), causing multiple properties and methods to change names and functionality. But this could be overcome (see lines #43-53 in draggableDataTips.m).

However, I could not overcome the apparent fact that unlike HG1 (or more specifically, schema objects, that HG1 uses for its data-tips functionality), in HG2 (or rather, MCOS class objects) we cannot override an object’s meta-properties, specifically its SetMethod (which is the MCOS equivalent of schema.prop‘s SetFunction meta-property).

So for the moment, draggableDataTips does not work on HG2. I hope to find a solution for this by the time HG2 launches. If anyone finds a fix for the problem, please let me know. If I ever find or receive a fix, I will update this post with the relevant technical details.

For the moment there is no rush, since HG2 is still relatively far away in the distant future, and draggableDataTips works splendidly in the current HG1.

Have you used plot data-tips in some nifty way? If so, please share your experience in a comment below.

 
Related posts:
  1. Controlling plot data-tips Data-tips are an extremely useful plotting tool that can easily be controlled programmatically....
  2. Accessing plot brushed data Plot data brushing can be accessed programmatically using very simple pure-Matlab code...
  3. Plot LimInclude properties The plot objects' XLimInclude, YLimInclude, ZLimInclude, ALimInclude and CLimInclude properties are an important feature, that has both functional and performance implications....
  4. Undocumented scatter plot jitter Matlab's scatter plot can automatically jitter data to enable better visualization of distribution density. ...
 

Performance: accessing handle properties

$
0
0

Graphic handle properties

There are several ways to access (read or update) Handle Graphics object properties. The simplest (and documented) way is to use the built-in get and set functions on the HG object’s handle. However, it is not the fastest: a significant speedup is possible (see below).

Accessing individual properties is so fast that this speedup may not seem important. Individual properties are accessed in tens or hundreds of microseconds, which is a very short time for most Matlab programs. Indeed, if our application seldom accesses properties, it is probably not worth the effort to optimize this particular aspect of the program:

% Individual property access is extremely fast:
hFig = figure;
tic, figName = get(hFig,'name'); toc  % Elapsed time is 0.000229 seconds. 
 
tic, set(hFig,'name','testing'); toc  % Elapsed time is 0.000270 seconds.

But if we have thousands of reads and/or updates, this could possibly become an important factor (drawnow calls are intentionally omitted to illustrate the effect):

% Using the standard set() function
tic, for idx=1:10000, set(hFig,'name','testing'); end, toc  % Elapsed time is 0.229772 seconds. 
 
% Using the HG handle() wrapper is about 25% faster (or 1.3x speedup):
tic
hFig = handle(hFig);
for idx=1:10000, set(hFig,'name','testing'); end
toc  % Elapsed time is 0.170205 seconds. 
 
% Using the HG handle() wrapper with dot notation is even faster (65% faster, or 2.7x speedup):
tic
hFig = handle(hFig);
for idx=1:10000, hFig.name='testing'; end
toc  % Elapsed time is 0.083762 seconds.

Similar results occur when trying to get() a property value:

% Using the standard set() function
tic, for idx=1:10000, s=get(hFig,'name'); end, toc   % Elapsed time is 0.140865 seconds.
 
% Using the HG handle() wrapper is about 25% faster (or 1.3x speedup):
tic, hFig=handle(hFig); for idx=1:10000, s=get(hFig,'name'); end, toc  % Elapsed time is 0.108543 seconds.
 
% Using the HG handle() wrapper with dot notation is even faster (62% faster, or 2.6x speedup):
tic, hFig=handle(hFig); for idx=1:10000, s=hFig.name; end, toc   % Elapsed time is 0.053423 seconds.

We learn from this that using the HG handle() wrapper function is useful for improving performance. This has the benefit of improving our code performance with minimal changes to our code, by simply updating our handle to be a handle() wrapper:

hFig = handle(hFig);

Using the handle’d handle enables further performance benefits if we use the dot notation (handle.propertyName), rather than use the familiar get/set functions.

Note that both the handle function and its beneficial effects on performance are undocumented.

Java reference properties

The same conclusions also hold true for Java objects, where it turns out that using handle() and the simple dot notation is 2-6 times as fast as using the Java set<PropName> and get<PropName> functions, due to Matlab-Java interface aspects:

jb = javax.swing.JButton;
 
% Using the standard set() function
tic, for idx=1:10000, set(jb,'Text','testing'); end, toc  % Elapsed time is 0.278516 seconds.
 
% Using the HG handle() wrapper is about 35% faster (or 1.6x speedup):
jhb = handle(jb);
tic, for idx=1:10000, set(jhb,'Text','testing'); end, toc   % Elapsed time is 0.175018 seconds.
 
% Using the HG handle() wrapper with dot notation is even faster (65% faster, or 2.8x speedup):
tic, for idx=1:10000, jhb.text='testing'; end, toc  % Elapsed time is 0.100239 seconds.
 
% Using the Java setText() function, is actually slower (faster with the handle() wrapper, but still slower than dot-notation):
tic, for idx=1:10000, jb.setText('testing'); end, toc  % Elapsed time is 0.587543 seconds.
tic, for idx=1:10000, jhb.setText('testing'); end, toc  % Elapsed time is 0.201635 seconds.

The same holds true also for retrieving property values via the get function.

User handle class properties

Exactly the same conclusions also apply to non-graphical user classes that derive from the base handle class regarding property access. In this case, we derive the hgsetget built-in class, which provides a handle class with the standard get/set functions. Note that this is documented – it is only the performance implications that are undocumented in this case.

We first create a simple class for testing:

% Define a simple handle class
classdef TestClass < hgsetget 
    properties
        name
    end
end

Now let’s test both sides of the property access (get/set) – first let’s set the property value:

obj = TestClass;
 
% Using the standard set() function
tic, for idx=1:10000, set(obj,'name','testing'); end, toc  % Elapsed time is 0.138276 seconds.
 
% Using class.propName notation - 72x faster!
tic, for idx=1:10000, obj.name='testing'; end, toc  % Elapsed time is 0.001906 seconds.

And similarly for retrieving a property value:

% Using the standard set() function
tic, for idx=1:10000, a=get(obj,'name'); end, toc  % Elapsed time is 0.105168 seconds.
 
% Using class.propName notation - 6.5x faster
tic, for idx=1:10000, a=obj.name; end, toc  % Elapsed time is 0.016179 seconds.

Conclusions

The general conclusion is that we should always strive to use the dot notation (handle.propertyName), rather than use the familiar get/set functions, in performance hotspots. Naturally, doing this in non-hotspot locations is futile, since accessing individual properties is relatively fast.

In the upcoming HG2, when all of Matlab's GUI and graphic objects will use Matlab classes, this conclusion will be more important than ever. Initial tests on the HG2 alpha (that anyone can access) show that they hold true for HG2 just as they do in the current HG1.

The handle() function wrapper produces a UDD (schema) object, so while I have not specifically tested non-HG schema objects, I would be very surprised if the conclusions do not hold true for all UDD objects in general.

I have also not [yet] tested other types of handles (ActiveX/COM, Dot-Net etc.) but again, I would be very surprised if the conclusions would be any different.

If this performance tip has piqued your interest, then you might be interested in the several hundred other tips in my upcoming book "MATLAB Performance Tuning" (CRC Press, 2014). I'll post a note on this blog letting everyone know when it's officially available. In the meantime, enjoy my other performance-related articles - there are already several dozen of them by now, and the list will continue to grow...

Editorial note: In the past month I've gone to quite a lot of effort to improve the performance of this website. Most users should now see pages loading about twice as fast as one month ago. The effect should be especially noticeable on mobile devices connected over mobile, which is much slower than wifi/cable. I still have a few additional tweak ideas, so I expect performance to slightly improve even further in the upcoming weeks. Enjoy reading!

 
Related posts:
  1. Accessing private object properties Private properties of Matlab class objects can be accessed (read and write) using some undocumented techniques. ...
  2. Displaying hidden handle properties I present two ways of checking undocumented hidden properties in Matlab Handle Graphics (HG) handles...
  3. Handle Graphics Behavior HG behaviors are an important aspect of Matlab graphics that enable custom control of handle functionality. ...
  4. Plot LimInclude properties The plot objects' XLimInclude, YLimInclude, ZLimInclude, ALimInclude and CLimInclude properties are an important feature, that has both functional and performance implications....
 

Property value change listeners

$
0
0

For performance reasons, it is almost always better to respond to events (asynchronously), than to continuously check a property value (synchronous polling). Therefore, if we wish to do something when some property value is changed (e.g., log the event, shut down the system, liquidate the portfolio, call the police, …), then it is preferable to attach a property-change listener callback.

The standard (documented) way of attaching a value-change listener to Matlab class properties is via the addlistener function. This only works for handle (not value) classes, and only to those properties that have the SetObservable and/or GetObservable attribute turned on:

addlistener(hClassObject, propertyName, 'PostSet', @myCallbackFcn);

This is all nice and well for Matlab class properties, but what about HG (handle Graphics: plots & GUI) properties? Can we similarly listen to changes in (say) the axes limits? Until now this has been possible, but undocumented. For example, this will trigger myCallbackFcn(hAxes,eventData) whenever the axes limits change (due to zoom, pan, plotting etc.):

addlistener(gca, 'YLim', 'PostSet', @(hAxes,eventData) myCallbackFcn(hAxes,eventData));
 
% Or (shorter equivalent):
addlistener(gca, 'YLim', 'PostSet', @myCallbackFcn);

This could be very useful when such properties could be modified from numerous different locations. Rather than updating all these location to call the relevant callback function directly, we simply attach the callback to the property-change listener. It could also be useful in cases where for some reason we cannot modify the source of the update (e.g., third-party or legacy code).

In addition to PostSet, we could also set listeners for PreSet. Also, we could set listeners on PostGet and PreGet – this could be useful for calculating dynamic (dependent) property values.

Under the hood

The HG1 variant of addlistener is basically equivalent to the following low-level UDD-based code snippet, as explained here:

% Create the listener object
hAxes = handle(gca);  % a UDD axes class object
hProp = findprop(hAxes,'YLim');  % a schema.prop class object
hListener = handle.listener(hAxes, hProp, 'PropertyPostSet', @myCallbackFcn);
 
% persist the listener in memory for as long as the source object (hAxes) is alive
setappdata(hAxes, 'listener__', hListener);

(in old Matlab releases, addlistener was a regular m-function that placed the listeners in the source handle’s ApplicationData property, as the code above shows; newer releases reimplemented addlistener as an internal built-in function and the listener is now stored somewhere in the DLL’s inaccessible memory, rather than in the ApplicationData property)

In HG2, handle.listener no longer works. Fortunately, we don’t need it since we have addlistener that works the same way for both HG1 (UDD objects) and HG2 (MCOS objects). Kudos on the backward-compatibility aspect, MathWorks!

 
Related posts:
  1. UDD Events and Listeners UDD event listeners can be used to listen to property value changes and other important events of Matlab objects...
  2. Getting default HG property values Matlab has documented how to modify default property values, but not how to get the full list of current defaults. This article explains how to do this. ...
  3. xlsread functionality change in R2012a The functionality of the xlsread function has changed without documentation or warning in the R2012a release. ...
  4. JIDE Property Grids The JIDE components pre-bundled in Matlab enable creating user-customized property grid tables...
 

Customizing axes rulers

$
0
0

Over 4 years have passed since I’ve posted my scoop on Matlab’s upcoming new graphics system (a.k.a. HG2, Handle Graphics version 2). At that time HG2 was still far from usable, but that has changed when I posted my HG2 update last year. Numerous user feedbacks, by email and blog comments, were reported and the MathWorks developers have listened and improved the code. HG2 was finally released with Matlab R2014b last Friday, and it seems at first glance to be a beauty. I hope my posts and the feedbacks have contributed, but in any case the MathWorks dev group deserves big kudos for releasing a totally new system that provides important usability and aesthetic improvements [almost] without sacrificing performance or backward-compatibility. Trust me, it’s not an easy achievement.

Customized HG2 plot

Customized HG2 plot


One of the nice things that I like about HG2 is that it provides numerous new ways to customize the objects in ways that were impossible (or nearly so) in the old HG1. In R2014b, the leap was large enough that MathWorks wisely chose to limit the official new properties to a bare minimum, for maximal HG1 compatibility. I assume that this will remain also in R2015a, which I expect to be a release devoted to bug fixing and stabilization rather than to new features. I expect the new features to start becoming official in R2015b onward. Such a measured roadmap is to be expected from a responsible engineering company such as MathWorks. So in fact there is no need at all to be disappointed at the relative lack of new functional features. They are all there already, just not yet official, and this is just as it should be.

That being said, if we are aware of the risk that these features might change in the upcoming years until they become official (if ever), then we can start using them today. Experience with this blog has shown that the vast majority of such undocumented features remain working unchanged for years, and some of them eventually become documented. For example, uitab/uitabgroup, on which I posted over 4 years ago, and which has existed almost unchanged since 2005, finally became official in R2014b after many years of running in unofficial form.

In the next few weeks I intend to present a series of posts that highlight some of the undocumented customizations in HG2. I’ll start with some new axes features, followed by plotting aspects.

By the way, “HG2″ is an internal name, that you will find scattered throughout the code but never in the official documentation. Apparently for marketing reasons, MathWorks chose to call it the “New Graphics Engine/System”. I’ll keep using the term HG2, as I think it sounds better than “NGE/NGS”. And besides, old habits die hard…

Axes Rulers

“Rulers” are the X, Y and Z axes lines and all their related aspects, including ticks, tick labels, and secondary label (see below). Some of the important aspects (e.g., ticks and tick labels) have mirror properties in the axes object, for convenience. The ruler objects can be accessed via the hidden properties (XRuler, YRuler and ZRuler, which can be seen using the getundoc utility):

>> x = -10:0.1:10;
>> y = 1e7*sin(x)./x; 
>> hLine = plot(x,y);
>> hAxes = gca;
 
>> yruler = hAxes.YRuler  % or: get(hAxes,'YRuler')
yruler = 
    NumericRuler
 
>> class(yruler)
ans =
matlab.graphics.axis.decorator.NumericRuler
 
>> get(yruler)
                               Axle: [1x1 LineStrip]
                           Children: []
                              Color: [0.15 0.15 0.15]
                           Exponent: 6
                 FirstCrossoverAxis: 0
                FirstCrossoverValue: -Inf
                          FontAngle: 'normal'
                           FontName: 'Helvetica'
                           FontSize: 10
                      FontSmoothing: 'on'
                         FontWeight: 'normal'
                   HandleVisibility: 'off'
                              Label: [1x1 Text]
                          LineWidth: 0.5
                         MajorTicks: [1x1 LineStrip]
                          MinorTick: [1x7 double]
                         MinorTicks: []
                             Parent: [1x1 DecorationContainer]
    PlaceSecondaryLabelAtLowerLimit: 'off'
                              Scale: 'linear'
               SecondCrossoverValue: -Inf
                     SecondaryLabel: [1x1 Text]
                               Tick: [1x8 double]
                            TickDir: 'in'
                          TickLabel: {8x1 cell}
               TickLabelInterpreter: 'tex'
                  TickLabelRotation: 0
                         TickLabels: [1x1 Text]
                         TickLength: 3.255
                            Visible: 'on'

The ruler object itself has plenty of very useful hidden properties (getundoc again…). In R2014b the number of hidden properties for *ALL* objects has multiplied – many standard properties now have hidden internal mirror properties having the “_I” suffix. For example, Tick is a visible property, and Tick_I is hidden. But there are of course other properties that are hidden and are not such internal mirrors. Today I’ll focus on the ruler’s visible properties only.

Axle property

The Axle property controls the axis line, which is a solid black line by default:

>> get(yruler.Axle)
          AlignVertexCenters: 'on'
             AmbientStrength: 0.3
                ColorBinding: 'object'
                   ColorData: [4x1 uint8]
                   ColorType: 'truecolor'
             DiffuseStrength: 0.6
            HandleVisibility: 'off'
                     HitTest: 'off'
                       Layer: 'back'
                   LineStyle: 'solid'
                   LineWidth: 0.5
               NormalBinding: 'none'
                  NormalData: []
                      Parent: [1x1 NumericRuler]
               PickableParts: 'none'
    SpecularColorReflectance: 1
            SpecularExponent: 10
            SpecularStrength: 0.9
                   StripData: [1 3 5]
                     Texture: []
                  VertexData: [3x4 single]
               VertexIndices: []
                     Visible: 'on'
       WideLineRenderingHint: 'software'

As you can see, there are many ways by which we can customize the Axle. For example, let’s use a dotted green line instead of the default solid black line:

hAxes.YRuler.Axle.LineStyle = 'dotted';  % default: 'solid', also possible: dashdot, dashed, none
hAxes.YRuler.Axle.ColorData = uint8([0,100,0,255])';  %=dark green; default: [51 51 51 255], corresponding to [0.2 0.2 0.2 1]

The result can be seen in the screenshot above.

ColorData is closely related to ColorType, which is ‘truecolor’ by default. There are also the alternative ‘colormapped’, ‘texturemapped’, and ‘truecoloralpha’. We can see the various possible combinations if we try to issue an illegal ColorData value:

>> yruler.Axle.ColorData = [.1,.2,.3];
While setting the 'ColorData' property of LineStrip:
Value must be one of the following:
Truecolor  - a 4xN array of type uint8
Colormapped - a 1xN vector of type single
Texturemapped - a 2xN array of type single

For Truecoloralpha, the fourth color value (255 in the example above) signifies the relative transparency: 0=transparent, 255=opaque, and values between 0-255 indicate the degree of translucency.

Note that the default Axle.ColorData sometimes changes between [51 51 51 255] and [38 38 38 255], I’m not sure exactly when this happens. In some cases the YRuler may use ColorData=51 while XRuler uses 38 (which is slightly darker).

We can make interesting effects by specifying non-default VertexData endpoints (array of 3xN singles that should correspond to a 1xN uint32 LineStrip). For example, an axle that spans only part of the axis line… – have fun :-)

Exponent and SecondaryLabel properties

The Exponent controls the computation of the tick label format. For example, in the example above Exponent=6 which means that SecondaryLabel.String=’\times10^{6}’. The exponent is automatically calculated by default, but we can override it to whatever integer we want (non-integer exponent values are rounded to the nearest integer):

hAxes.YRuler.Exponent = -3;

This way we can force the exponent to always have a certain value, or to always display engineering values (multiples of 3). We can do this by attaching a listener to the corresponding axes’ limits, e.g. YLim for the Y-axes.

In addition to forcing the Exponent value, we can also specify a non-numeric SecondaryLabel. For example:

hAxes.YRuler.SecondaryLabel.String = 'millions';  % original: 'x10^{6}'
hAxes.YRuler.SecondaryLabel.FontAngle = 'italic';  % default: 'normal'
hAxes.YRuler.SecondaryLabel.Visible = 'on';  % default: 'off'
 
% Alternative:
set(hAxes.YRuler.SecondaryLabel, 'String','millions', 'FontAngle','italic', 'Visible','on');

The result can be seen in the screenshot above.

Call for action

Go ahead – play around with the new HG2. It’s a lot of fun and quite painless with the new object.property notation. If you have any feedback on the features above or any other, please do share them in a comment below. I’m quite sure that MathWorks will read these comments and this may be a way for you to influence the features that may someday become officially supported. More to the point, make your graphics become even more stunning then they have already become with out-of-the-box HG2!

The HG2 customization series will continue next week with a discussion of additional new axes properties, including Baseline, BoxFrame and GridHandle.

 
Related posts:
  1. Customizing axes part 2 Matlab HG2 axes can be customized in many different ways. This article explains some of the undocumented aspects. ...
  2. Customizing axes part 3 – Backdrop Matlab HG2 axes can be customized in many different ways. This article explains some of the undocumented aspects. ...
  3. Customizing axes part 4 – additional properties Matlab HG2 axes can be customized in many different ways. This article explains some of the undocumented aspects. ...
  4. Determining axes zoom state The information of whether or not an axes is zoomed or panned can easily be inferred from an internal undocumented object....
 

Customizing axes part 2

$
0
0

Last week I explained how HG2 (in R2014b) enables us to customize the axes rulers in ways that were previously impossible in HG1 (R2014a or earlier). Today I will describe other useful undocumented customizations of the HG2 axes:

Baseline

A baseline is a line that has some important meaning. For example, in a plot of the sin function, we might want to place a horizontal baseline at Y=0 or Y=-1, and similarly a vertical baseline at X=0. In HG1, we could do this programmatically using extra line commands (presumably with the additional *LimInclude properties). In HG2 it becomes easier – we can simply update the relevant baseline’s properties: XBaseline, YBaseline and ZBaseLine. All baselines are automatically created with a value of 0, color=gray and Visible=’off’. For example, continuing last week’s example:

HG2 axes Baseline

HG2 axes Baseline

% Create the plot
x = -10:0.1:10;
y = 1e7*sin(x)./x; 
hLine = plot(x,y);
hAxes = gca;
 
% Display the default YBaseline's property values
% Note: there are also plenty of hidden properties that can be gotten with getundoc()
>> hAxes.YBaseline.get
           BaseValue: 0
            Children: []
               Color: [0.15 0.15 0.15]
    HandleVisibility: 'off'
           LineStyle: '-'
           LineWidth: 0.5
              Parent: [1x1 DecorationContainer]
             Visible: 'off'
 
% Display a horizontal YBaseline with custom color
hAxes.YBaseline.Color = 'b';  % default: [0.15 0.15 0.15]
hAxes.YBaseline.Visible = 'on';  % default: 'off'
 
% Hide the bottom x-axis, to make the Y-baseline stand out
hAxes.XRuler.Axle.Visible = 'off';  % default: 'on'

Note the horizontal blue Y-baseline. also note how I hid the bottom x-axis, in order to make the Y-baseline stand out.

Translucent colors can be specified by entering a 4-element color vector. For example: [1, 0, 0, 0.5] means a 50%-transparent red.

For extra prominence, you might want to increase the baseline’s LineWidth from its default value of 0.5 to a value of 1 or 2.

Another useful customization is to set a non-zero BaseValue, or a non-solid baseline LineStyle.

While YBaseline is normally a horizontal line that relates to the Y-axis (hAxes.YBaseline.Axis==1), we can make it vertical attached to the X-axis by simply modifying its Axis value to 0 (0=X, 1=Y, 2=Z).

For the record, baselines are matlab.graphics.axis.decorator.Baseline class objects.

BoxFrame

The BoxFrame property controls the “box” lines that surround the plot when we issue a box(‘on’) command. This is normally a simple black square/rectangle for 2D plots, and a simple black background wireframe for a 3D plot. But who said it needs to be boring?

surf(peaks);  % 3D plot
box on;  % standard black box wireframe
boxFrame = get(gca,'BoxFrame');  % or: hAxes.BoxFrame
set(boxFrame, 'XColor','r', 'YColor','b', 'ZColor','g');  % default colors: [0.15 0.15 0.15]
HG2 axes BoxFrame

HG2 axes BoxFrame


The BoxFrame object is a matlab.graphics.axis.decorator.BoxFrame class object that, like the rulers and baseline, can be customized (once the box(‘on’) command has been issued):
>> get(boxFrame)
           AxesLayer: 'bottom'
            BackEdge: [1x1 LineStrip]
            Children: []
           FrontEdge: [1x1 LineStrip]
    HandleVisibility: 'off'
           LineWidth: 0.5
              Parent: [1x1 DecorationContainer]
             Visible: 'off'
              XColor: [0.15 0.15 0.15]
              YColor: [0.15 0.15 0.15]
              ZColor: [0.15 0.15 0.15]

By default, only the box frame’s back-edge is displayed (axes BoxStyle property =’back’). We can modify this behavior by setting the axes’ BoxStyle to ‘full’, but we can have much more control if we simply update the properties of the box-frame object. For example:

set(boxFrame.FrontEdge, 'Visible','on', 'LineStyle','dashdot', 'LineWidth',1);  %defaults: 'off', 'solid', 0.5

As with the Ruler.Axle objects (see last week’s article), we can customize the Vertex points and colors to achieve very colorful effects (anyone say psychedelic?)

GridHandle

In HG2, MathWorks have dramatically improved the appearance of the grid-lines, making them a much lighter, less-obtrusive gray color. Even more importantly, we now have fine-grained control over the grid lines, via the axes’ hidden XGridHandle, YGridHandle and ZGridHandle properties. These return an empty handle when the grid is not shown, and a matlab.graphics.axis.decorator.SimpleGrid class object when the relevant grid-lines are displayed.

>> grid on
>> xgrid = get(gca,'XGridHandle');  % or: hAxes.XGridHandle
>> get(xgrid)
           BackMajorEdge: [1x1 LineStrip]
           BackMinorEdge: [1x1 LineStrip]
                Children: []
                   Color: [0.15 0.15 0.15]
      FirstCrossoverAxis: 0
     FirstCrossoverValue: 0
          FrontMajorEdge: [1x1 LineStrip]
          FrontMinorEdge: [1x1 LineStrip]
           GridLineStyle: '-'
        HandleVisibility: 'off'
               LineWidth: 0.5
              MajorMinor: 'major'
               MajorTick: [-10 -8 -6 -4 -2 0 2 4 6 8 10]
              MinorColor: [0.1 0.1 0.1]
      MinorGridLineStyle: ':'
          MinorLineWidth: 0.5
               MinorTick: []
                  Parent: [1x1 DecorationContainer]
    SecondCrossoverValue: 0
                 Visible: 'on'

As before, we can customize the grid line’s LineWidth, GridLineStyle, and Color. MajorMinor can accept ‘major’ (default), ‘minor’, or ‘majorandminor’, which is pretty intuitive.

customized HG2 axes X-grid

customized HG2 axes X-grid

set(xgrid,'Color','r', 'GridLineStyle',':', 'LineWidth',1.5, 'MajorMinor','majorandminor');

To control the tick lines in 3D plot we can set BackMajorEdge, BackMinorEdge, FrontMajorEdge and FrontMinorEdge in the same way as we did for the BoxFrame. By default only the back-edges are visible. If you wish to also display the front edges, then set the front edge’s Visible to ‘on’ and don’t forget to modify its VertexData to different values than the back edge’s VertexData. As before, colorful effects can be achieved in the grid-lines by customizing the edge objects’ properties:

>> xgrid.BackMajorEdge.get
          AlignVertexCenters: 'on'
             AmbientStrength: 0.3
                ColorBinding: 'object'
                   ColorData: [4x1 uint8]
                   ColorType: 'truecolor'
             DiffuseStrength: 0.6
            HandleVisibility: 'off'
                     HitTest: 'off'
                       Layer: 'back'
                   LineStyle: 'dotted'
                   LineWidth: 1.5
               NormalBinding: 'none'
                  NormalData: []
                      Parent: [1x1 SimpleGrid]
               PickableParts: 'visible'
    SpecularColorReflectance: 1
            SpecularExponent: 10
            SpecularStrength: 0.9
                   StripData: [1 3 5 7 9 11]
                     Texture: []
                  VertexData: [3x10 single]
               VertexIndices: []
                     Visible: 'on'
       WideLineRenderingHint: 'software'

A note about performance

MATLAB HG2, on R2014b, relies on advanced OpenGL hardware features much more than earlier releases. When Matlab detects an incompatible display driver, it issues a warning and reverts to using the much slower software implementation. It is advisable to update the display driver to the very latest version, since this often solves such incompatibilities.

Some computer vendors use custom OEM drivers and their latest version might still be incompatible. For example, on my Lenovo E530 laptop, the latest Intel HG Graphics 4000 driver (v.9.15) was still incompatible; although the system told me that I have the very latest driver installed. I downloaded the latest generic driver (v.10.18) from Intel’s website and this fixed the issue: HG2 now uses hardware-accelerated OpenGL on my laptop, which is much faster. It may not be as 100% compatible with my laptop as the custom OEM version, but so far it appears to work ok and importantly Matlab graphics now work much better. I can always roll-back the driver to the OEM driver if I see a problem with the generic driver.

Next week I will continue my series on Matlab axes customizations, by describing Backdrop, WarpToFill and a few other aspects. Stay tuned!

 
Related posts:
  1. Customizing axes part 4 – additional properties Matlab HG2 axes can be customized in many different ways. This article explains some of the undocumented aspects. ...
  2. Customizing axes part 3 – Backdrop Matlab HG2 axes can be customized in many different ways. This article explains some of the undocumented aspects. ...
  3. Customizing axes rulers HG2 axes can be customized in numerous useful ways. This article explains how to customize the rulers. ...
  4. Determining axes zoom state The information of whether or not an axes is zoomed or panned can easily be inferred from an internal undocumented object....
 

Customizing axes part 3 – Backdrop

$
0
0

In the past two weeks I explained how HG2 (in R2014b) enables us to customize the axes rulers, baselines, box and grid-lines in ways that were previously impossible in HG1 (R2014a or earlier). Today I will describe another useful undocumented property of the HG2 axes – Backdrop.

HG2 axes Backdrop with custom tint

HG2 axes Backdrop with custom tint


Backdrop

The axes’ Backdrop property (a matlab.graphics.axis.decorator.Backdrop object) controls the background color of the axes’ content area. This is normally white, but can be set to any color, including translucency:

% Create the plot
x = -10:0.1:10;
y = 1e7*sin(x)./x; 
hLine = plot(x,y);
hAxes = gca;
box('off');
 
% Set a light-yellow backdrop
hAxes.Backdrop.FaceColor = [1, 1, 0, 0.4];

HG2 axes Backdrop

HG2 axes Backdrop

By default, Backdrop spans the entire (rectangular) axes content area. But we can customize its vertex points using the Face.VertexData property, which accepts an array of 3xN singles:

HG2 axes Backdrop with custom vertex points

HG2 axes Backdrop with custom vertex points

% Note: VertexData is specified in normalized (0-1) units, not data units
hAxes.Backdrop.Face.VertexData = single([0,1,0.8,0; 0,0.43,0.75,1; 0,0,0,0]);  % default: [0,1,1,0; 0,0,1,1; 0,0,0,0]
 
>> hAxes.Backdrop.Face.get
             AmbientStrength: 0.3
             BackFaceCulling: 'none'
                ColorBinding: 'object'
                   ColorData: [4x1 uint8]
                   ColorType: 'truecoloralpha'
             DiffuseStrength: 0.6
            HandleVisibility: 'off'
                     HitTest: 'off'
                       Layer: 'back'
               NormalBinding: 'none'
                  NormalData: []
                      Parent: [1x1 Backdrop]
               PickableParts: 'all'
    SpecularColorReflectance: 1
            SpecularExponent: 10
            SpecularStrength: 0.9
                   StripData: []
                     Texture: []
            TwoSidedLighting: 'off'
                  VertexData: [3x4 single]
               VertexIndices: []
                     Visible: 'on'

The down side is that whenever we modify anything in the axes (or even get some axes property values), Face.VertexData is reset back to its default value of [0,1,1,0; 0,0,1,1; 0,0,0,0], so we need to either update it in a timer and/or in a property listener.

We can create a tint (gradient color) effect by setting the Face.ColorData property to match the vertex points and modifying Face.ColorBinding from the default ‘object’ to ‘interpolated’ (other alternative values are ‘discrete’ and ‘none’):

colorData = uint8([255, 150, 200, 100; ...  % instead of [255;255;0;102] = light-yellow
                   255, 100,  50, 200; ...
                     0,  50, 100, 150; ...
                   102, 150, 200,  50]);
set(hAxes.Backdrop.Face, 'ColorBinding','interpolated', 'ColorData',colorData);

HG2 axes Backdrop with custom vertex, tint

HG2 axes Backdrop with custom vertex, tint

The tint effect does not rely on the vertex – we can set a tinted background for the entire content area by modifying Face.ColorData without modifying the vertexes:

HG2 axes Backdrop with custom tint

HG2 axes Backdrop with custom tint

Using a patch

Of course, one could say that using Backdrop is not much better than creating a patch that has the specified vertex points and colors. For example (note that Backdrop has different color and vertex units than a patch):

% Create a patch to replace the backdrop
cdata = [255, 150, 200, 100; ...
         255, 100,  50, 200; ...
           0,  50, 100, 150 ...
        ]' / 255;  % alpha values are not directly accepted by patch CData
vertexData = [0,1,0.8,0; 0,0.43,0.75,1];  % in normalized units
xdata = hAxes.XLim(1) + diff(hAxes.XLim)*vertexData(1,:);  % in data units
ydata = hAxes.YLim(1) + diff(hAxes.YLim)*vertexData(2,:);  % in data units
hPatch = patch(xdata, ydata, 'k', 'Parent',hAxes, 'EdgeColor','none', ...
               'FaceVertexCData',cdata, 'FaceColor','interp', ...
               'FaceVertexAlpha',[102;150;200;50]/255, 'FaceAlpha','interp');

This results in a gradient very similar to the Backdrop, although not exactly the same. Perhaps the color interpolation for Backdrop is different than for patches, or maybe I just made a mistake somewhere above…

Standard patch with custom tint

Standard patch with custom tint

I don’t have a good answer as to why MathWorks chose to add the Backdrop property to HG2 axes and what advantage it might have over a separate patch. If anyone has an idea, please post a comment below. We can be pretty sure that this was discussed at MathWorks, since Michelle Hirsch, who heads Matlab product development at MathWorks, posted a utility that implements a patch-based gradient backdrop back in 2010 and has recently rehosted it on GitHub:

Michelle Hirsch's patch-based gradient backdrop utility

Michelle Hirsch's patch-based gradient backdrop utility

Next week, I will conclude the mini-series on axes customizations by describing some additional undocumented axes features.

 
Related posts:
  1. Customizing axes part 2 Matlab HG2 axes can be customized in many different ways. This article explains some of the undocumented aspects. ...
  2. Customizing axes part 4 – additional properties Matlab HG2 axes can be customized in many different ways. This article explains some of the undocumented aspects. ...
  3. Customizing axes rulers HG2 axes can be customized in numerous useful ways. This article explains how to customize the rulers. ...
  4. Determining axes zoom state The information of whether or not an axes is zoomed or panned can easily be inferred from an internal undocumented object....
 

Customizing axes part 4 – additional properties

$
0
0

In the past three weeks I explained how HG2 (in R2014b) enables us to customize the axes rulers, back-drop, baselines, box and grid-lines in ways that were previously impossible in HG1 (R2014a or earlier). Today I will conclude the mini-series on axes customizations by describing other useful undocumented customizations of the HG2 axes:

Camera

The Camera object (matlab.graphics.axis.camera.Camera3D) controls the 3D camera/lighting of the axes. Camera is a new hidden property of HG2 axes, that did not exist in earlier Matlab releases (HG1). This functionality is normally controlled via the 3D figure toolbar and related functions (view, camup, campos etc.). We can have better granularity by discretely customizing Camera‘s properties:

>> hAxes.Camera.get
               AspectRatio: 1
                  Children: []
      DepthCalculationHint: 'careful'
                 DepthSort: 'on'
          HandleVisibility: 'off'
                    Parent: [1x1 Axes]
        PlotBoxAspectRatio: [1 1 1]
    PlotBoxAspectRatioMode: 'auto'
                  Position: [-4.06571071756541 -5.45015005218426 4.83012701892219]
                Projection: 'orthographic'
                    Target: [0.5 0.5 0.5]
    TransparencyMethodHint: 'depthpeel'
                  UpVector: [0 0 1]
                 ViewAngle: 10.339584907202
                  Viewport: [1x1 matlab.graphics.general.UnitPosition]
                   Visible: 'on'
                WarpToFill: 'vertical'

SortMethod

SortMethod is a newly-supported axes property in R2014b. It is new only in the sense that it became documented: It has existed in its present form also in previous Matlab releases, as a hidden axes property (I’m not sure exactly from which release). This is yet another example of an undocumented Matlab functionality that existed for many years before MathWorks decided to make it official (other examples in R2014b are the set of uitab/uitabgroup functions).

SortMethod is important due to its impact on graphic rendering performance: By default, Matlab draws objects in a back-to-front order based on the current view. This means that objects (lines, patches etc.) which should appear “on top” of other objects are drawn last, overlapping the objects “beneath” them. Calculating the order of the objects, especially in complex plots having multiple overlapping segments, can take noticeable time. We can improve performance by telling the renderer to draw objects in the order of the Children property, which is typically the order in which the objects were created. This can be done by setting the axes’ SortMethod property to ‘childorder’ (default=’depth’). Since SortOrder existed in past Matlab releases as well, we can use this technique on the older MATLAB releases just as for R2014b or newer.

In a related matter, we should note that transparent/translucent patches and lines (having a 4th Color element (alpha) value between 0.0 and 1.0) are slower to render for much the same reasons. Reducing the number of transparent/translucent objects will improve graphics rendering performance. Note that specifying a 4th Color element is again an undocumented feature: Matlab officially only supports RGB triplets and named color strings, not RGBA quadruplets. I’ll discuss this aspect next week.

WarpToFill

WarpToFill (default=’on’) is a simple flag that controls whether or not the axes should fill its container (panel or figure), leaving minimal margins. We can consider this as another variant to the documented alternatives of the axis function:

surf(peaks);
set(gca,'WarpToFill','off');

HG2 axes WarpToFill on HG2 axes WarpToFill off

HG2 axes WarpToFill (on, off)

Note that WarpToFill is not new in R2014b – it has existed in its present form also in previous Matlab releases, as a hidden axes property. One would hope that it will finally become officially supported, as SortMethod above has.

Additional properties

Additional undocumented aspects of Matlab axes that I have reported over the years, including the LooseInset property and determining axes zoom state, still work in HG2 (R2014b). They might be removed someday, but hopefully they will take the opposite path that SortMethod did, of becoming fully supported.

On the other hand, some important undocumented HG1 axes properties have been removed: x_NormRenderTransform, x_ProjectionTransform, x_RenderOffset, x_RenderScale, x_RenderTransform, x_ViewPortTransform and x_ViewTransform could be used in HG1 axes to map between 3D and 2D data spaces. Some users have already complained about this. I have [still] not found a simple workaround for this, but I’m pretty sure that there is one. Maybe the hidden axes DataSpace property could be used for this, but I’m not sure how exactly.

This concludes my series on undocumented HG2 axes customizations (at least for now). Next week, I will describe undocumented HG2 plot-line customizations.

 
Related posts:
  1. Customizing axes part 2 Matlab HG2 axes can be customized in many different ways. This article explains some of the undocumented aspects. ...
  2. Customizing axes part 3 – Backdrop Matlab HG2 axes can be customized in many different ways. This article explains some of the undocumented aspects. ...
  3. Plot LimInclude properties The plot objects' XLimInclude, YLimInclude, ZLimInclude, ALimInclude and CLimInclude properties are an important feature, that has both functional and performance implications....
  4. Performance: accessing handle properties Handle object property access (get/set) performance can be significantly improved using dot-notation. ...
 

Plot line transparency and color gradient

$
0
0

In the past few weeks, I discussed the new HG2 axes Backdrop and Baseline properties with their associated ability to specify the transparency level using a fourth (undocumented) element in their Color.

In other words, color in HG2 can still be specified as an RGB triplet (e.g., [1,0,0] to symbolize bright red), but also via a 4-element quadruplet RGBA, where the 4th element (Alpha) signifies the opacity level (0.0=fully transparent, 0.5=semi-transparent, 1.0=opaque). So, for example, [1, 0, 0, 0.3] means a 70%-transparent red.

This Alpha element is not documented anywhere as being acceptable, but appears to be supported almost universally in HG2 wherever a color element can be specified. In some rare cases (e.g., for patch objects) Matlab has separate Alpha properties that are fully documented, but in any case nowhere have I seen documented that we can directly set the alpha value in the color property, especially for objects (such as plot lines) that do not officially support transparency. If anyone finds a documented reference anywhere, please let me know – perhaps I simply missed it.

Here is a simple visualization:

xlim([1,5]);
hold('on');
h1a = plot(1:5,     11:15, '.-', 'LineWidth',10, 'DisplayName',' 0.5');
h1b = plot(1.5:5.5, 11:15, '.-', 'LineWidth',10, 'DisplayName',' 1.0', 'Color',h1a.Color);  % 100% opaque
h1a.Color(4) = 0.5;  % 50% transparent
h2a = plot(3:7,  15:-1:11, '.-r', 'LineWidth',8, 'DisplayName',' 0.3'); h2a.Color(4)=0.3;  % 70% transparent
h2b = plot(2:6,  15:-1:11, '.-r', 'LineWidth',8, 'DisplayName',' 0.7'); h2b.Color(4)=0.7;  % 30% transparent
h2c = plot(1:5,  15:-1:11, '.-r', 'LineWidth',8, 'DisplayName',' 1.0');  % 100% opaque = 0% transparent
legend('show','Location','west')

Transparent HG2 plot lines

Transparent HG2 plot lines

Now for the fun part: we can make color-transition (gradient) effects along the line, using its hidden Edge property:

>> h2b.Edge.get
          AlignVertexCenters: 'off'
             AmbientStrength: 0.3
                ColorBinding: 'object'
                   ColorData: [4x1 uint8]
                   ColorType: 'truecoloralpha'
             DiffuseStrength: 0.6
            HandleVisibility: 'off'
                     HitTest: 'off'
                       Layer: 'middle'
                   LineStyle: 'solid'
                   LineWidth: 8
               NormalBinding: 'none'
                  NormalData: []
                      Parent: [1x1 Line]
               PickableParts: 'visible'
    SpecularColorReflectance: 1
            SpecularExponent: 10
            SpecularStrength: 0.9
                   StripData: [1 6]
                     Texture: []
                  VertexData: [3x5 single]
               VertexIndices: []
                     Visible: 'on'
       WideLineRenderingHint: 'software'
 
>> h2b.Edge.ColorData  %[4x1 uint8]
ans =
  255
    0
    0
  179

The tricky part is to change the Edge.ColorBinding value from its default value of ‘object’ to ‘interpolated’ (there are also ‘discrete’ and ‘none’). Then we can modify Edge.ColorData from being a 4×1 array of uint8 (value of 255 corresponding to a color value of 1.0), to being a 4xN matrix, where N is the number of data points specified for the line, such that each data point along the line will get its own unique RGB or RGBA value. (the data values themselves are kept as a 3xN matrix of single values in Edge.VertexData).

So, for example, let’s modify the middle (30%-transparent) red line to something more colorful:

>> cd=uint8([255,200,250,50,0; 0,50,250,150,200; 0,0,0,100,150; 179,150,200,70,50])
cd =
  255  200  250   50    0
    0   50  250  150  200
    0    0    0  100  150
  179  150  200   70   50
 
>> set(h2b.Edge, 'ColorBinding','interpolated', 'ColorData',cd)

HG2 plot line color, transparency gradient

HG2 plot line color, transparency gradient

As you can see, we can interpolate not only the colors, but also the transparency along the line.

Note: We need to update all the relevant properties together, in a single set() update, otherwise we’d get warning messages about incompatibilities between the property values. For example:

>> h2b.Edge.ColorBinding = 'interpolated';
Warning: Error creating or updating LineStrip
 Error in value of property ColorData
 Array is wrong shape or size
(Type "warning off MATLAB:gui:array:InvalidArrayShape" to suppress this warning.)

Markers

Note how the markers are clearly seen in the transparent lines but not the opaque ones. This is because the markers have the same color as the lines in today’s example. Since the lines are wide, the markers are surrounded by pixels of the same color. Therefore, the markers are only visible when the surrounding pixels are less opaque (i.e., lighter).

As a related customization, we can control whether the markers appear “on top of” (in front of) the line or “beneath” it by updating the Edge.Layer property from ‘middle’ to ‘front’ (there is also ‘back’, but I guess you won’t typically use it). This is important for transparent lines, since it controls the brightness of the markers: “on top” (in front) they appear brighter. As far as I know, this cannot be set separately for each marker – they are all updated together.

Of course, we could always update the line’s fully-documented MarkerSize, MarkerFaceColor and MarkerEdgeColor properties, in addition to the undocumented customizations above.

Next week I will describe how we can customize plot line markers in ways that you never thought possible. So stay tuned :-)

 
Related posts:
  1. Draggable plot data-tips Matlab's standard plot data-tips can be customized to enable dragging, without being limitted to be adjacent to their data-point. ...
  2. Plot LineSmoothing property LineSmoothing is a hidden and undocumented plot line property that creates anti-aliased (smooth unpixelized) lines in Matlab plots...
  3. Plot LimInclude properties The plot objects' XLimInclude, YLimInclude, ZLimInclude, ALimInclude and CLimInclude properties are an important feature, that has both functional and performance implications....
  4. Controlling plot data-tips Data-tips are an extremely useful plotting tool that can easily be controlled programmatically....
 

Plot markers transparency and color gradient

$
0
0

Last week I explained how to customize plot-lines with transparency and color gradient. Today I wish to show how we can achieve similar effects with plot markers. Note that this discussion (like the preceding several posts) deal exclusively with HG2, Matlab’s new graphics system starting with R2014b (well yes, we can also turn HG2 on in earlier releases).

As Paul has noted in a comment last week, we cannot simply set a 4th (alpha transparency) element to the MarkerFaceColor and MarkerEdgeColor properties:

>> x=1:10; y=10*x; hLine=plot(x,y,'o-');
>> hLine.MarkerFaceColor = [0.5,0.5,0.5];      % This is ok
>> hLine.MarkerFaceColor = [0.5,0.5,0.5,0.3];  % Not ok
While setting the 'MarkerFaceColor' property of Line:
Color value must be a 3 element numeric vector

Standard Matlab plot markers

Standard Matlab plot markers

Lost cause? – not in a long shot. We simply need to be a bit more persuasive, using the hidden MarkerHandle property:

>> hMarkers = hLine.MarkerHandle;  % a matlab.graphics.primitive.world.Marker object
 
>> hMarkers.get
    EdgeColorBinding: 'object'
       EdgeColorData: [4x1 uint8]
       EdgeColorType: 'truecolor'
    FaceColorBinding: 'object'
       FaceColorData: [4x1 uint8]
       FaceColorType: 'truecolor'
    HandleVisibility: 'off'
             HitTest: 'off'
               Layer: 'middle'
           LineWidth: 0.5
              Parent: [1x1 Line]
       PickableParts: 'visible'
                Size: 6
               Style: 'circle'
          VertexData: [3x10 single]
       VertexIndices: []
             Visible: 'on'
 
>> hMarkers.EdgeColorData'  % 4-element uint8 array
ans =
    0  114  189  255
 
>> hMarkers.FaceColorData'  % 4-element uint8 array
ans =
  128  128  128  255

As we can see, we can separately attach transparency values to the marker’s edges and/or faces. For example:

hMarkers.FaceColorData = uint8(255*[1;0;0;0.3]);  % Alpha=0.3 => 70% transparent red

70% Transparent Matlab plot markers

70% Transparent Matlab plot markers

And as we have seen last week, we can also apply color gradient across the markers, by modifying the EdgeColorBinding/FaceColorBinding from ‘object’ to ‘interpolated’ (there are also ‘discrete’ and ‘none’), along with changing the corresponding FaceColorData/EdgeColorData from being a 4×1 array to a 4xN array:

>> colorData = uint8([210:5:255; 0:28:252; [0:10:50,40:-10:10]; 200:-10:110])
colorData =
  210  215  220  225  230  235  240  245  250  255
    0   28   56   84  112  140  168  196  224  252
    0   10   20   30   40   50   40   30   20   10
  200  190  180  170  160  150  140  130  120  110
 
>> set(hMarkers,'FaceColorBinding','interpolated', 'FaceColorData',colorData)

Matlab plot markers with color and transparency gradients

Matlab plot markers with color and transparency gradients

This can be useful for plotting comet trails, radar/sonar tracks, travel trajectories, etc. We can also use it to overlay meta-data information, such as buy/sell indications on a financial time-series plot. In fact, it opens up Matlab plots to a whole new spectrum of customizations that were more difficult (although not impossible) to achieve earlier.

Throughout today, we’ve kept the default FaceColorType/EdgeColorType value of ‘truecolor’ (which is really the same as ‘truecoloralpha’ as far as I can tell, since both accept an alpha transparency value as the 4th color element). If you’re into experimentation, you might also try ‘colormapped’ and ‘texturemapped’.

 
Related posts:
  1. Plot line transparency and color gradient Static and interpolated (gradient) colors and transparency can be set for plot lines in HG2. ...
  2. Plot LimInclude properties The plot objects' XLimInclude, YLimInclude, ZLimInclude, ALimInclude and CLimInclude properties are an important feature, that has both functional and performance implications....
  3. Draggable plot data-tips Matlab's standard plot data-tips can be customized to enable dragging, without being limitted to be adjacent to their data-point. ...
  4. Undocumented scatter plot jitter Matlab's scatter plot can automatically jitter data to enable better visualization of distribution density. ...
 

Accessing hidden HG2 plot functionality

$
0
0

I received two separate reader queries in the past 24 hours, asking how to access certain functionalities in HG2 (R2014b)’s new graphics system. These functionalities were previously accessible in HG1 (R2014a and earlier), but stopped being [readily] accessible in HG2. The functionalities have not disappeared, they have merely changed the way in which they can be accessed. Moreover, with the new graphics system they were even expanded in terms of their customizability.

In both cases, the general way in which I approached the problem was the same, and I think this could be used in other cases where you might need some HG1 functionality which you cannot find how to access in HG2. So try to read today’s article not as a specific fix to these two specific issues, but rather as a “how-to” guide to access seemingly inaccessible HG2 features.

Accessing contour fills

Contour fills were implemented in HG1 as separate HG objects that could be accessed using findall or allchild. This could be used to set various properties of the fills, such as transparency. This broke in HG2 as reported by reader Leslie: the contours are no longer regular HG children. No complaints there – after all, it was based on undocumented internal features of the data-brushing functionality.

It turns out that the solution for HG2 is not difficult, using the contour handle’s hidden FacePrims property:

[~, hContour] = contourf(peaks(20), 10);
drawnow;  % this is important, to ensure that FacePrims is ready in the next line!
hFills = hContour.FacePrims;  % array of matlab.graphics.primitive.world.TriangleStrip objects
for idx = 1 : numel(hFills)
   hFills(idx).ColorType = 'truecoloralpha';   % default = 'truecolor'
   hFills(idx).ColorData(4) = 150;   % default=255
end

Contour plot in HG2, with and without transparency

Contour plot in HG2, with and without transparency


The contour fills are now stored as an array of TriangleStrip objects, which can be individually customized:

>> get(hFills(1))
             AmbientStrength: 0.3
             BackFaceCulling: 'none'
                ColorBinding: 'object'
                   ColorData: [4x1 uint8]
                   ColorType: 'truecoloralpha'
             DiffuseStrength: 0.6
            HandleVisibility: 'on'
                     HitTest: 'off'
                       Layer: 'middle'
               NormalBinding: 'none'
                  NormalData: []
                      Parent: [1x1 Contour]
               PickableParts: 'visible'
    SpecularColorReflectance: 1
            SpecularExponent: 10
            SpecularStrength: 0.9
                   StripData: [1 4 11 14 19 25 28 33]
                     Texture: []
            TwoSidedLighting: 'off'
                  VertexData: [3x32 single]
               VertexIndices: []
                     Visible: 'on'

Accessing plot brushed data

In October 2010 I published an article explaining how to programmatically access brushed data in Matlab plots (brushed data are highlighted data points using the interactive data-brushing tool on the figure toolbar). Apparently, data brushing was implemented as a data line having only the data-brushed points in its data, and using dedicated markers. This worked well in HG1, until it too broke in HG2, as reported by reader bash0r.

It turns out that in HG2, you can access the brushing data using the plot line’s hidden BrushHandles property, as follows:

hBrushHandles = hLine.BrushHandles;
hBrushChildrenHandles = hBrushHandles.Children;  % Marker, LineStrip

I described the new Marker objects here, and LineStrip objects here. The brushed vertex data can be retrieved from either of them. For example:

>> hBrushChildrenHandles(1).VertextData
ans = 
     1     2     3     4     % X-data of 4 data points
     1     2     3     4     % Y-data of 4 data points
     0     0     0     0     % Z-data of 4 data points

If you only need the brushed data points (not the handles for the Markers and LineStrip, you can get them directly from the line handle, using the hidden BrushData property:

>> brushedIdx = logical(hLine.BrushData);  % logical array (hLine.BrushData is an array of 0/1 ints)
>> brushedXData = hLine.XData(brushedIdx);
>> brushedYData = hLine.YData(brushedIdx)
brushedYData =
     1     2     3     4

Data brushing in HG2

Data brushing in HG2

A general “how-to” guide

In order to generalize these two simple examples, we see that whereas the HG objects in HG1 were relatively “flat”, in HG2 they became much more complex objects, and their associated functionality is now embedded within deeply-nested properties, which are in many cases hidden. So, if you find a functionality for which you can’t find a direct access via the documented properties, it is very likely that this functionality can be accessed by some internal hidden property.

In order to list such properties, you can use my getundoc utility, or simply use the built-in good-ol’ struct function, as I explained here. For example:

>> warning('off','MATLAB:structOnObject')  % turn off warning on using struct() on an object. Yeah, we know it's bad...
>> allProps = struct(hContour)
allProps = 
                 FacePrims: [11x1 TriangleStrip]
             FacePrimsMode: 'auto'
               FacePrims_I: [11x1 TriangleStrip]
                 EdgePrims: [10x1 LineStrip]
             EdgePrimsMode: 'auto'
               EdgePrims_I: [10x1 LineStrip]
                 TextPrims: []
             TextPrimsMode: 'auto'
               TextPrims_I: []
             ContourMatrix: [2x322 double]
         ContourMatrixMode: 'auto'
           ContourMatrix_I: [2x322 double]
             ContourZLevel: 0
         ContourZLevelMode: 'auto'
           ContourZLevel_I: 0
                      Fill: 'on'
                  FillMode: 'auto'
                    Fill_I: 'on'
                      Is3D: 'off'
                  Is3DMode: 'auto'
                    Is3D_I: 'off'
              LabelSpacing: 144
                       ...   % (many more properties listed)

This method can be used on ALL HG2 objects, as well as on any internal objects that are referenced by the listed properties. For example:

>> allProps = struct(hContour.FacePrims)
allProps = 
             StripDataMode: 'manual'
               StripData_I: [1 4 11 14 19 25 28 33]
                 StripData: [1 4 11 14 19 25 28 33]
       BackFaceCullingMode: 'auto'
         BackFaceCulling_I: 'none'
           BackFaceCulling: 'none'
      FaceOffsetFactorMode: 'manual'
        FaceOffsetFactor_I: 0
          FaceOffsetFactor: 0
        FaceOffsetBiasMode: 'manual'
          FaceOffsetBias_I: 0.0343333333333333
            FaceOffsetBias: 0.0343333333333333
      TwoSidedLightingMode: 'auto'
        TwoSidedLighting_I: 'off'
          TwoSidedLighting: 'off'
                   Texture: []
               TextureMode: 'auto'
                       ...   % (many more properties listed)

In some cases, the internal property may not be directly accessible as object properties, but you can always access them via the struct (for example, allProps.StripData).

Do you use any HG1 functionality in your code that broke in HG2? Did my “how-to” guide above help you recreate the missing functionality in HG2? If so, please share your findings with all of us in a comment below.

 
Related posts:
  1. Accessing plot brushed data Plot data brushing can be accessed programmatically using very simple pure-Matlab code...
  2. Performance: accessing handle properties Handle object property access (get/set) performance can be significantly improved using dot-notation. ...
  3. Plot line transparency and color gradient Static and interpolated (gradient) colors and transparency can be set for plot lines in HG2. ...
  4. Controlling plot data-tips Data-tips are an extremely useful plotting tool that can easily be controlled programmatically....
 

Customizing Matlab uipanels

$
0
0

The major innovation in Matlab release R2014b was the introduction of the new handle-based graphics system (HG2). However, this release also included a few other improvements to graphics/GUI that should not be overlooked. The most notable is that uitabs are finally officially documented/supported, following a decade or being undocumented (well, undocumented in the official sense, since I took the time to document this functionality in this blog and in my Matlab-Java book).

A less-visible improvement occurred with uipanels: Panels are very important containers when designing GUIs. They enable a visual grouping of related controls and introduce order to an otherwise complex GUI. Unfortunately, until R2014b panels were drawn at the canvas level, and did not use a standard Java Swing controls like other uicontrols. This made it impossible to customize uipanels in a similar manner to other GUI uicontrols (example).

In R2014b, uipanels have finally become standard Java Swing controls, a com.mathworks.hg.peer.ui.UIPanelPeer$UIPanelJPanel component that extends Swing’s standard javax.swing.JPanel and Matlab’s ubiquitous com.mathworks.mwswing.MJPanel. This means that we can finally customize it in various ways that are not available in plain Matlab.

We start the discussion with a simple Matlab code snippet. It is deliberately simple, since I wish to demonstrate only the panel aspects:

figure('Menubar','none', 'Color','w');
hPanel = uipanel('Title','Panel title', 'Units','norm', 'Pos',[.1,.1,.6,.7]);
hButton = uicontrol('String','Click!', 'Parent',hPanel);

Standard Matlab uipanel

Standard Matlab uipanel

Notice the default ‘etchedin’ panel border, which I hate (note the broken edges at the corners). Luckily, Swing includes a wide range of alternative borders that we can use. I’ve already demonstrated customizing Matlab uicontrols with Java borders back in 2010 (has it really been that long? wow!). In R2014b we can finally do something similar to uipanels:

The first step is to get the uipanel‘s underlying Java component’s reference. We can do this using my findjobj utility, but in the specific case of uipanel we are lucky to have a direct shortcut by using the panel’s undocumented hidden property JavaFrame and its PrintableComponent property:

>> jPanel = hPanel.JavaFrame.getPrintableComponent
jPanel =
com.mathworks.hg.peer.ui.UIPanelPeer$UIPanelJPanel[,0,0,97x74,...]

Let’s now take a look at the jPanel‘s border:

>> jPanel.getBorder
ans =
com.mathworks.hg.peer.ui.borders.TitledBorder@25cd9b97
 
>> jPanel.getBorder.get
                Border: [1x1 com.mathworks.hg.peer.ui.borders.EtchedBorderWithThickness]
          BorderOpaque: 0
                 Class: [1x1 java.lang.Class]
                 Title: 'Panel title'
            TitleColor: [1x1 java.awt.Color]
             TitleFont: [1x1 java.awt.Font]
    TitleJustification: 1
         TitlePosition: 2

Ok, simple enough. Let’s replace the border’s EtchedBorderWithThickness with something more appealing. We start with a simple red LineBorder having rounded corners and 1px width:

jColor = java.awt.Color.red;  % or: java.awt.Color(1,0,0)
jNewBorder = javax.swing.border.LineBorder(jColor, 1, true);  % red, 1px, rounded=true
jPanel.getBorder.setBorder(jNewBorder);
jPanel.repaint;  % redraw the modified panel

Rounded-corners LineBorder

Rounded-corners LineBorder

Or maybe a thicker non-rounded orange border:

jColor = java.awt.Color(1,0.5,0);
jNewBorder = javax.swing.border.LineBorder(jColor, 3, false);  % orange, 3px, rounded=false
jPanel.getBorder.setBorder(jNewBorder);
jPanel.repaint;  % redraw the modified panel

Another LineBorder example

Another LineBorder example

Or maybe a MatteBorder with colored insets:

jColor = java.awt.Color(0,0.3,0.8);  % light-blue
jNewBorder = javax.swing.border.MatteBorder(2,5,8,11,jColor)  % top,left,bottom,right, color
jPanel.getBorder.setBorder(jNewBorder);
jPanel.repaint;  % redraw the modified panel

MatteBorder with solid insets

MatteBorder with solid insets

MatteBorder can also use an icon (rather than a solid color) to fill the border insets. First, let’s load the icon. We can either load a file directly from disk, or use one of Matlab’s standard icons. Here are both of these alternatives:

% Alternative #1: load from disk file
icon = javax.swing.ImageIcon('C:\Yair\star.gif');
 
% Alternative #2: load a Matlab resource file
jarFile = fullfile(matlabroot,'/java/jar/mlwidgets.jar');
iconsFolder = '/com/mathworks/mlwidgets/graphics/resources/';
iconURI = ['jar:file:/' jarFile '!' iconsFolder 'favorite_hoverover.png'];  % 14x14 px
icon = javax.swing.ImageIcon(java.net.URL(iconURI));

We can now pass this icon reference to MatteBorder‘s constructor:

w = icon.getIconWidth;
h = icon.getIconHeight;
jNewBorder = javax.swing.border.MatteBorder(h,w,h,w,icon)  % top,left,bottom,right, icon
jPanel.getBorder.setBorder(jNewBorder);
jPanel.repaint;  % redraw the modified panel

MatteBorder with icon insets

MatteBorder with icon insets

Additional useful Swing borders can be found in the list of classes implementing the Border interface, or via the BorderFactory class. For example, let’s create a dashed border having a 3-2 ratio between the line lengths and the spacing:

jColor = java.awt.Color.blue;  % or: java.awt.Color(0,0,1);
lineWidth = 1;
relativeLineLength = 3;
relativeSpacing = 2;
isRounded = false;
jNewBorder = javax.swing.BorderFactory.createDashedBorder(jColor,lineWidth,relativeLineLength,relativeSpacing,isRounded);
jPanel.getBorder.setBorder(jNewBorder);
jPanel.repaint;  % redraw the modified panel

StrokeBorder (dashed)

StrokeBorder (dashed)

After seeing all these possibilities, I think you’ll agree with me that Matlab’s standard uipanel borders look pale in comparison.

Have you used any interesting borders in your Matlab GUI? Or have you customized your panels in some other nifty manner? If so, then please place a comment below.

 
Related posts:
  1. Transparent uipanels Matlab uipanels can be made transparent, for very useful effects. ...
  2. Customizing Matlab labels Matlab's text uicontrol is not very customizable, and does not support HTML or Tex formatting. This article shows how to display HTML labels in Matlab and some undocumented customizations...
  3. Customizing uicontrol border Matlab uicontrol borders can easily be modified - this article shows how...
  4. Customizing editboxes Matlab's editbox can be customized in many useful manners...
 

Transparent legend

$
0
0

I’ve been working lately on Matlab program for a client, which attempts to mimic the appearance and behavior of MetaTrader charts, which are extensively used by traders to visualize financial timeseries and analysis indicators.

Such charts are often heavily laden with information, and a legend can be handy to understand the meaning of the various plot lines. Unfortunately, in such heavily-laden charts the legend box typically overlaps the data. We can of course move the legend box around (programmatically or by interactive dragging). But in such cases it might be more useful to have the legend background become semi- or fully-transparent, such that the underlying plot lines would appear beneath the legend:

Matlab chart with a semi-transparent legend (click for details)

A few months ago I explained the undocumented feature of setting the transparency level of plot lines by simply specifying a fourth numeric (alpha) value to the Color property. Unfortunately, this technique does not work for all graphic objects. For example, setting a 4th (alpha) value to the MarkerFaceColor property results in an error. In the case of legends, setting a 4th (alpha) value to the legend handle’s Color property does not result in an error, but is simply ignored.

The solution in the case of legends is similar in concept to that of the MarkerFaceColor property, which I explained here. The basic idea is to use one of the legend’s hidden properties (in this case, BoxFace) in order to access the low-level color properties (which I have already explained in previous posts):

>> hLegend = legend(...);
>> hLegend.Color = [0.5, 0.5, 0.5, 0.8];  % should be 20%-transparent gray, but in fact opaque gray
 
>> hLegend.BoxFace.get
             AmbientStrength: 0.3
             BackFaceCulling: 'none'
                ColorBinding: 'object'
                   ColorData: [4x1 uint8]
                   ColorType: 'truecolor'
             DiffuseStrength: 0.6
            HandleVisibility: 'on'
                     HitTest: 'off'
                       Layer: 'back'
               NormalBinding: 'none'
                  NormalData: []
                      Parent: [1x1 Group]
               PickableParts: 'visible'
    SpecularColorReflectance: 1
            SpecularExponent: 10
            SpecularStrength: 0.9
                   StripData: []
                     Texture: []
            TwoSidedLighting: 'off'
                  VertexData: [3x4 single]
               VertexIndices: []
                     Visible: 'on'
 
>> hLegend.BoxFace.ColorData  % 4x1 uint8
ans =
  128
  128
  128
  255   % this is the alpha value

As can be seen from this code snippet, the RGB ingredients (but not the alpha value) of Color have passed through to the BoxFace‘s ColorData. The problem stems from BoxFace‘s default ColorType value of 'truecolor'. Once we set it to 'truecoloralpha', we can set ColorData‘s alpha value to a value between uint8(0) and uint8(255):

set(hLegend.BoxFace, 'ColorType','truecoloralpha', 'ColorData',uint8(255*[.5;.5;.5;.8]));  % [.5,.5,.5] is light gray; 0.8 means 20% transparent
Opaque (default) legend20% transparent legend50% transparent legend
0% transparent (default)20% transparent50% transparent
ColorData = [128;128;128;255][128;128;128;204][128;128;128;128]

Note 1: ColorData only accepts a column-vector of 4 uint8 values between 0-255. Attempting to set the value to a row vector or non-uint8 values will result in an error.

Note 2: once we update the BoxFace color, the legend’s standard Color property loses its connection to the underlying BoxFace.ColorData, so updating hLegend.Color will no longer have any effect.

BoxFace.ColorType also accepts 'colormapped' and 'texturemapped' values; the BoxFace.ColorBinding accepts values of 'none', 'discrete' and 'interpolated', in addition to the default value of 'object'. Readers are encouraged to play with these values for colorful effects (for example, gradient background colors).

Finally, note that this entire discussion uses Matlab’s new graphics engine (HG2), on R2014b or newer. For those interested in semi-transparent legends in R2014a or older (HG1), this can be done as follows:

% Prepare a fully-transparent legend (works in both HG1, HG2)
hLegend = legend(...);
set(hLegend, 'Color','none');  % =fully transparent
 
% This fails in HG2 since patch cannot be a child of a legend,
% but it works well in HG1 where legends are simple axes:
patch('Parent',hLegend, 'xdata',[0,0,1,1,0], 'ydata',[0,1,1,0,0], 'HitTest','off', 'FaceColor','y', 'FaceAlpha',0.2);  % 0.2 = 80% transparent

Note that making legends fully-transparent is easy in either HG1 or HG2: simply set the legend’s Color property to 'none'. In HG2 this causes a quirk that the legend background becomes non-draggable (you can only drag the legend box-frame – transparent HG2 backgrounds to not trap mouse evens in the same way that opaque backgrounds do (i.e., when the HG2 legend has Color='w', the background is draggable just like the box-frame). In HG1, this does not happen, so a transparent background is just as draggable as an opaque one.

In any case, as noted above, while making the legend fully-transparent is simple, making it semi-transparent is more problematic. Which is where this post could help.

If you’ve found any other interesting use of these undocumented/hidden legend properties, please share it in a comment below. If you’d like me to develop a custom GUI (such as the charting program above or any other GUI) for you, please contact me by email or using my contact form.

 
Related posts:
  1. Multi-column (grid) legend This article explains how to use undocumented axes listeners for implementing multi-column plot legends...
  2. Transparent uipanels Matlab uipanels can be made transparent, for very useful effects. ...
  3. Plot line transparency and color gradient Static and interpolated (gradient) colors and transparency can be set for plot lines in HG2. ...
  4. Legend ‘-DynamicLegend’ semi-documented feature The built-in Matlab legend function has a very useful semi-documented feature for automatic dynamic update, which is explained here....
 
Viewing all 39 articles
Browse latest View live